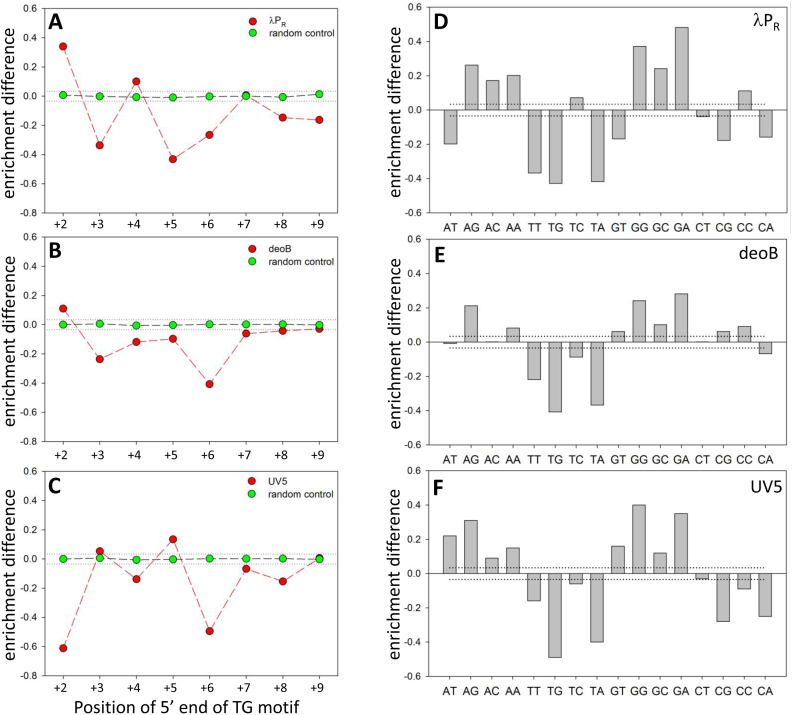
Figure 7.
Effect of TG motif at a specific position within +2 to +10 region in a context of λPR promoter (A), deoB promoter (B) and UV5 promoter (C) on escape kinetics averaged over all base combinations at remaining positions (16,384 sequences for each TG position). Enrichment difference (y axis) corresponds to a difference between calculated averaged enrichment with TG at a given position and the average of all enrichment values in the dataset. Random control (green symbols) corresponds to calculations performed on 16,384 randomly selected sequences. Dinucleotide sequence preferences at +5 (λPR promoter; panel D) or +6 (deoB promoter, panel E; UV5 promoter, panel F). Dotted lines depict boundary for statistical significance of enrichment differences over the random control (i.e. enrichment differences between and outside the dotted lines have P-values >0.0001 and <0.0001, respectively).

