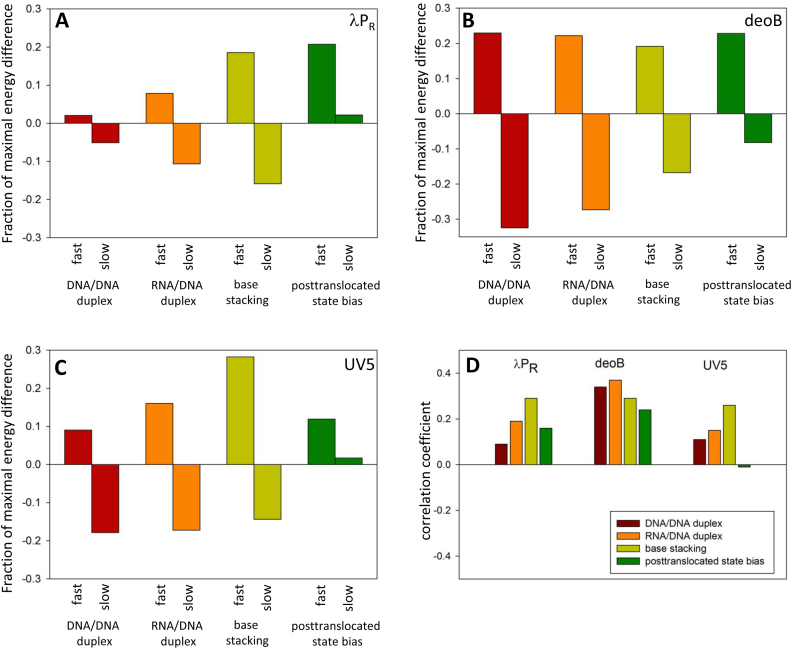
Figure 9.
DNA/DNA duplex stability, RNA/DNA duplex stability, base stacking energy and posttranslocated state bias for fast (top 500 enrichment values) and slow (bottom 500 enrichment values) sequences for λPR (A), deoB (B) and UV5 (C). The Y-axis depicts a difference between the average value for fast or slow sequences and the average value for all 262 144 variants of 9 nt sequence. This difference is expressed as a fraction of maximal energy difference from the average within all variants of 9 nt sequence. (D) Correlation between enrichment values and DNA/DNA duplex stability, RNA/DNA duplex stability, base stacking energy and posttranslocated state bias. All energy differences between fast and slow sequences in panels A–C were statistically significant (P-value < 0.0001). All correlation coefficients in panel D (with the exception of posttranslocated state in case of UV5) were statistically significant (P-value < 0.0001).

