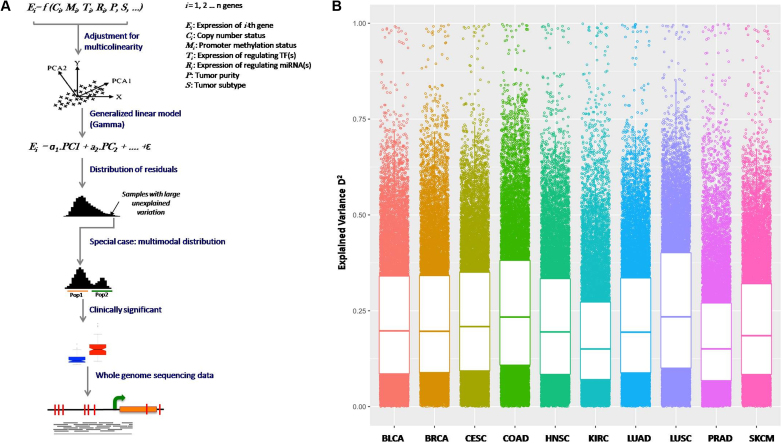
Figure 2.
(A) somExVar workflow: multiple genomic and epigenomic features (potential regulators), as mentioned in Figure 1 are integrated for 10 different cancer types, and a generalized principal component regression is implemented with normalized gene expression as the response variable. Model residuals are modeled using Gamma or log-normal distributions, and genes with high proportions of unexplained variance by the features included in model are prioritized, and investigated for pathway enrichment and burden of potential regulatory somatic mutations. As a special case, genes showing systematic expression variation i.e. bimodality in residual distribution are scanned for recurrent somatic mutations in their regulatory regions and tested for association with clinical features in the available samples. B) Gene expression variation explained (PVE; here represented by D2) by all features in the model for all genes across different cancers. Each point is a gene and higher value represents higher gene expression variation explained. PVE (D2) for cancer genes across all cancer types is shown in Supplementary Figure S4B.

