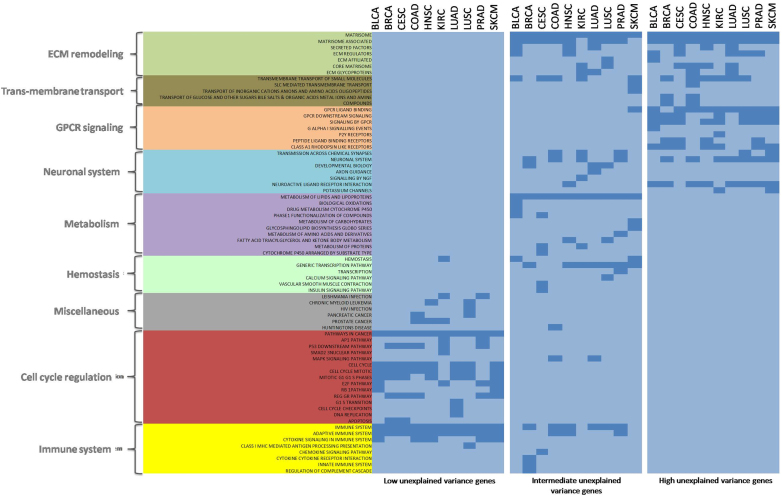
Figure 3.
Pathway enrichment analysis for genes with low (bottom 5% genes), intermediate (mid 50–60%), and high (top 5% genes) unexplained variance in gene expression across all cancers. ECM remodeling and GPCR signaling pathways were consistently significant across almost all cancer types in top 5% genes (low PVE) genes, whereas bottom 5% genes (high PVE) show almost exclusive enrichment for cell cycle related pathways. Color intensity represents –log10(FDR-p.value). Dark blue color represents significance.

