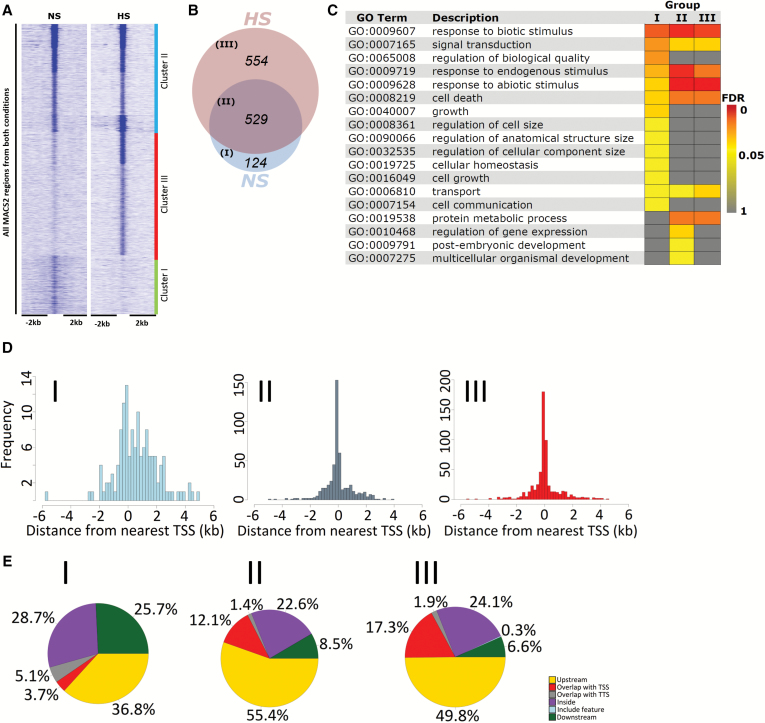
Fig. 1.
Alteration of HSFA1b binding in response to HS. (A) Heat map with k-means clustering showing the enrichment of ChIP-seq signals from NS and HS samples at a 4 kb window around HSFA1b-bound regions in the genome. (B) Venn diagram showing the number of HSFA1b target genomic features in Groups I–III. (C) GO Slim analysis heat map comparing genomic features of enriched Biological Process terms in Group I–III with Benjamini–Hochberg FDR <0.05. (D) Three histograms showing the frequency of HSFA1b binding relative to the distance from the TSS of target genomic features in Groups I–III. (E) Pie charts showing the distribution of HSFA1b binding on target genomic features in Groups I–III.

