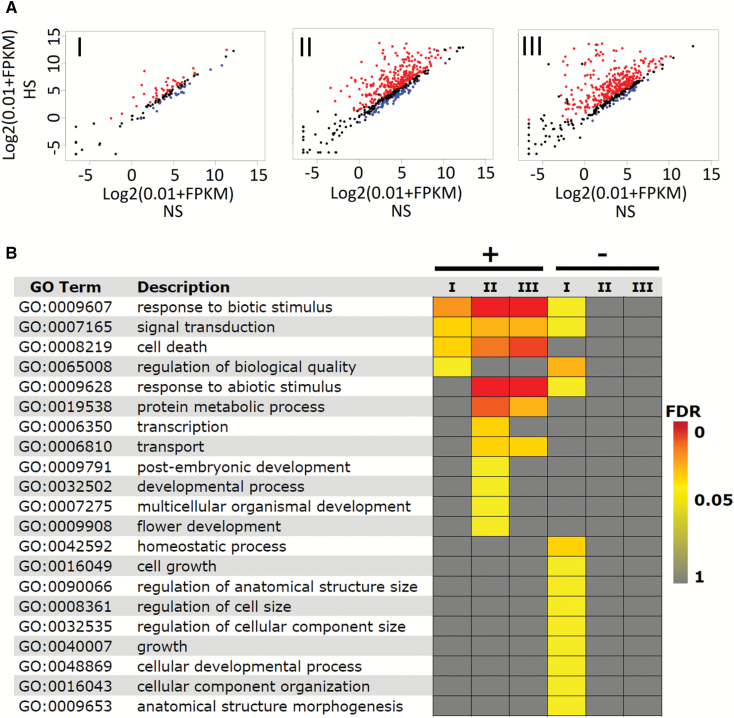
Fig. 3.
Most HSFA1b target genes are responsive to HS. (A) Scatter plots of transcript abundance of HSFA1b target genes in response to HS. Red and blue dots represent up- and down-regulated genes, respectively (q≤0.05), and black dots show genes with expression q>0.05. The numbers shown in each panel are the number of DEGs in each group. (B) GO Slim analysis heat map comparing the enriched BP terms of up- (+) and down- (–) regulated HS-responsive genes in Groups I–III (Benjamini–Hochberg FDR <0.05).

