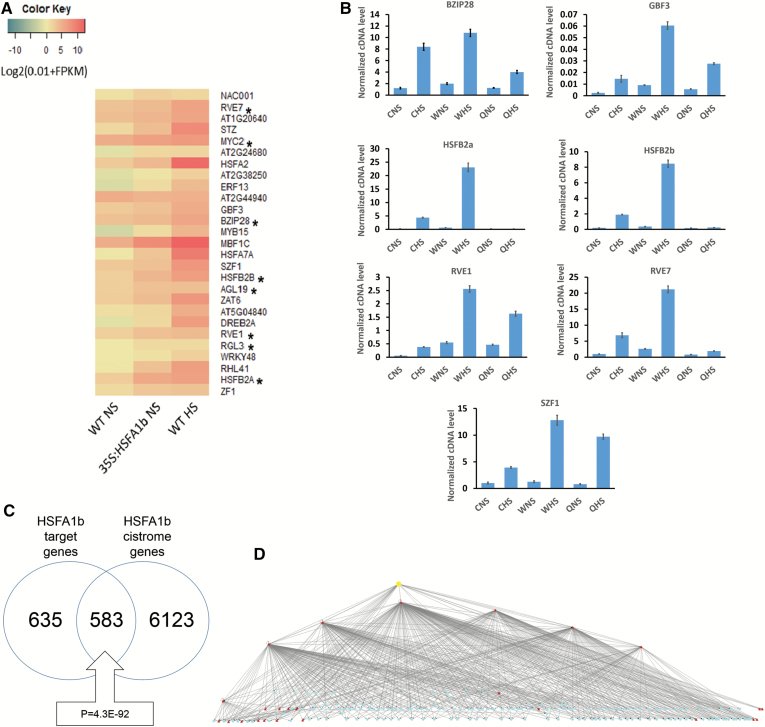
Fig. 5.
HSFA1b can indirectly control expression through its regulation of TF gene expression. (A) Heat map comparing normalized FPKM values for 28 TF genes bound by HSFA1b and differentially expressed in 35S:HSFA1b and WT HS plants. Asterisks (*) indicate development-associated TF genes. (B) Confirmation of the regulation of selected TF genes by clade A1 HSF genes. Quantitative real-time RT–PCR was conducted on RNA from qKO rosettes under NS and HS in comparison with its parental genotypes Col-0 (C) and Ws-0 (W). The suffixes ‘a’ and ‘b’ are where the qKO mutant shows a significant difference (P<0.05) under the same conditions (NS or HS) from Col-0 and Ws-0, respectively. (C) Venn diagram showing the overlap between HSFA1b target genes scored from the ChIP-seq data (Supplementary Data S1) and the target genes bound by HSFA1b (HSF3) from the Arabidopsis Cistrome Atlas (http://neomorph.salk.edu/dev/pages/shhuang/dap_web/pages/index.php). The boxed callout number is the P-value for the significance of the overlap between the two data sets (hypergeometric distribution test). (D) An overview of a Cytoscape-generated HSFA1b hierarchical TF gene network using the data outputs from the Cistrome Atlas with the ChIP-seq and RNA-seq data from this study. The yellow node is HSFA1b, red nodes are TF genes bound by HSFA1b, and blue nodes are differentially expressed TF genes that respond to HS and HSFA1b overexpression, are not bound by HSFA1b, but are scored as binding to the red node TFs. An interactive version of this network is available as an interactive file (Supplementary Cytoscape File S1).

