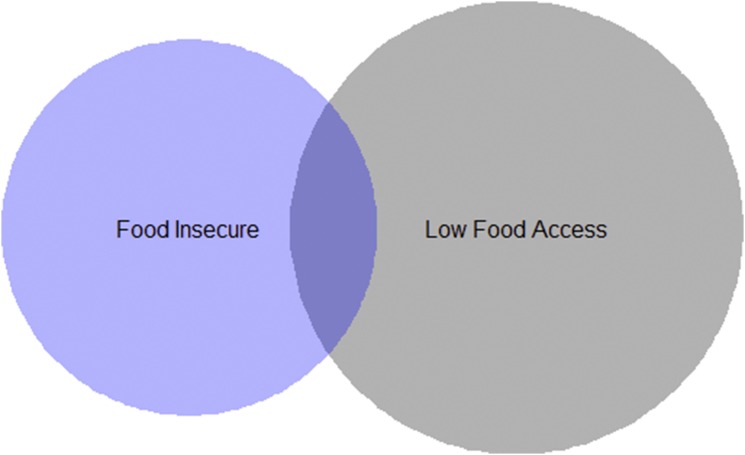
Figure 1.
Proportional Venn diagram showing overlap between those with food insecurity and those living in a census tract with low physical food access (1 mile in urban area and 10 miles in rural area definition). Seventy-eight (20%) participants were food insecure, 120 (10%) lived in an area of low physical food access, and 12 (3%) were both food insecure and lived in an area of low physical food access.

