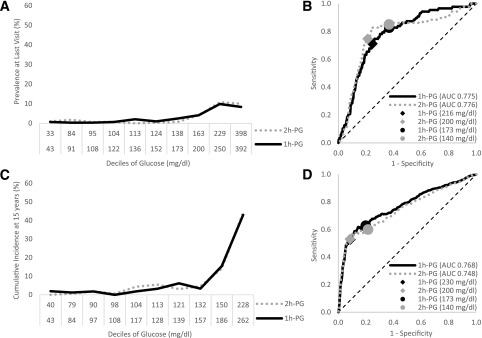
Figure 1.
Prevalence (A and B) and predicted incidence at 15 years (C and D) of any retinopathy based on direct ophthalmoscopy. Retinopathy in relation to glucose deciles (A and C) and ROC curves (B and D) of 1h-PG and 2h-PG concentrations. The glucose values shown in A and C are the lower bounds for each decile.

