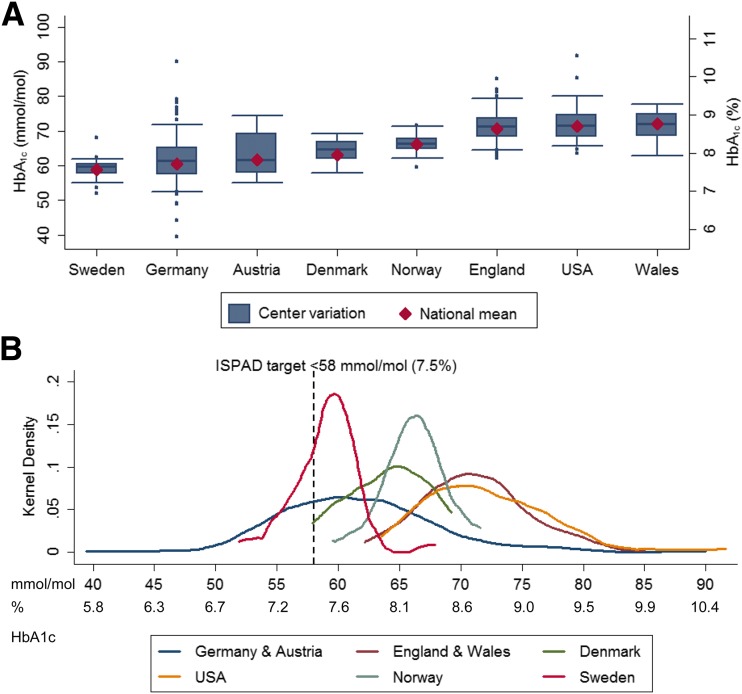
Figure 1.
Between-center variation in HbA1c across countries. Center means derived from linear fixed-effects regression models adjusted for patient characteristics (sex, age, duration of diabetes, and minority status). A: Boxplots showing center variation in adjusted mean HbA1c across eight countries. The shaded box represents the interquartile range capturing the middle 50% of the centers. Whiskers extend to include centers within 1.5 times the interquartile range beyond the upper and lower quartiles; dots outside the whiskers represent outlying centers; crude national average HbA1c values are represented by diamonds. B: Kernel-smoothed distribution of adjusted center HbA1c means by registry/audit. The dashed vertical line represents the ISPAD glycemic target recommended for children with diabetes.

