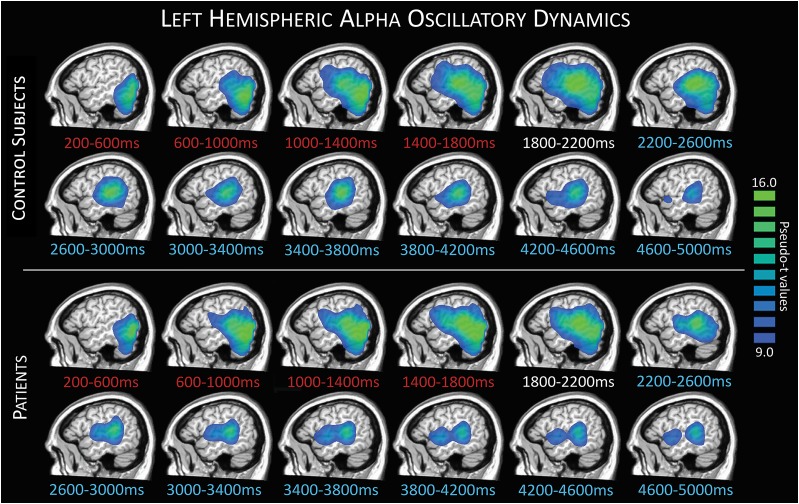
Figure 3.
Left hemisphere response dynamics. Group-averaged images per time window during encoding (red text), transition (white text), and maintenance (blue text) periods depict the evolution of responses during task performance. Control group averages are shown in the top panel, with patient group averages below. A strong decrease in alpha activity relative to the baseline can be seen during encoding time bins, starting in occipital and stretching forward to more parietal, superior temporal, and inferior frontal regions through later encoding, transition, and into maintenance.

