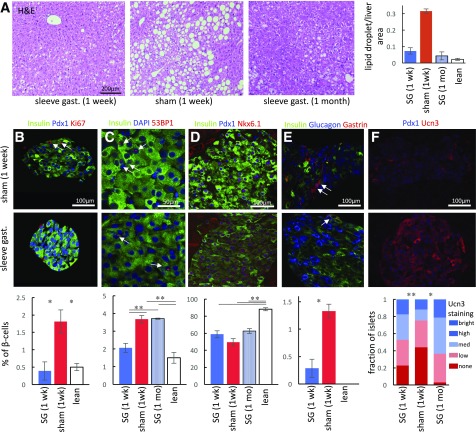
Figure 2.
Hepatic and pancreatic response to SG. A: Hematoxylin-eosin staining of liver section 1 week after SG (left) or sham surgery (middle) and 1 month after SG (right). Fractional area of lipid droplets in livers of operated mice shown on the right (n = 3–6). B–F: Immunohistochemical staining of pancreata from sham-operated (top) and SG-operated (bottom) mice. Quantification of staining shown below the images (n = 5–7 mice). B: SG reduces β-cell proliferation back to levels seen in lean mice. Nuclear Ki67 staining marking proliferating cells shown with arrows. C: SG transiently reduces DNA damage in β-cells to levels seen in lean mice. Red foci indicate nuclei experiencing DNA damage (arrows). D: SG increases nuclear colocalization of the β-cell transcription factors Pdx1 and Nkx6.1. E: SG reduces the number of gastrin-expressing cells (arrows), marking stressed endocrine cells. Gastrin is not expressed in pancreatic islets of lean mice. F: SG increases the fraction of islets expressing high levels of Ucn3, marking functional islets. All images taken under the same settings. Quantification shows pooled islets from all mice because of high intramouse variability among islets. Error bars indicate SEM. *P < 0.05, **P < 0.01 by unpaired Student t test. gast., gastrectomy.

