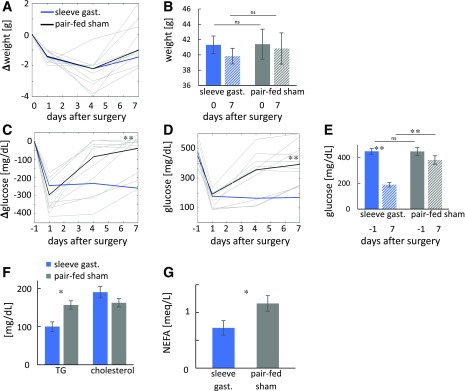
Figure 3.
Glycemia is improved by SG- but not in pair-fed sham-operated db/db mice. A–E: Weight and nonfasting glucose levels of SG-fed (n = 15–20) and pair-fed sham-operated mice (n = 9–15) 1 week after surgery. Glucose and weight were measured at days 1, 4, and 7. Data for SG-operated mice as in Fig. 1. A: Change in weight in SG- and pair-fed sham-operated mice relative to weight at surgical time. Median weight shown in dark colors and individual weight in light colors. B: Mean weight at day of surgery and 7 days after surgery. C: Change in nonfasting glucose levels compared with the day before surgery. Colors as in A. D: Glucose levels at the day before surgery and after surgery. Colors as in A. E: Mean glucose levels at the day before surgery and 7 days after surgery. F: Mean triglycerides (TG) and total cholesterol. G: NEFAs in SG- and pair-fed sham-operated mice (n = 4–5). *P < 0.05, **P < 0.01 by two-way ANOVA with Bonferroni-corrected Tukey honest significant difference test (A–E) or Student t test (F and G). gast., gastrectomy; ns, not significant.

