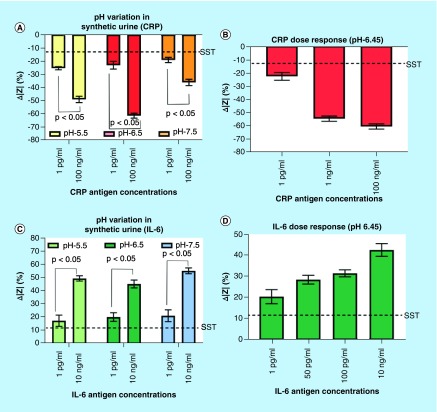
Figure 3. . Electrochemical impedance spectroscopy characterization of CRP and IL-6 in synthetic urine.
(A) Change in impedance analysis for low and high CRP antigen concentrations in three pH ranges of synthetic urine. Dotted lines indicate SST; (B) Impedance analysis for pH 6.45 synthetic urine; (C) Change in impedance analysis for low and high IL-6 antigen concentrations in three pH buffer ranges of synthetic urine. The dotted lines indicate SST; (D) Change in impedance analysis for four IL-6 antigen concentrations in pH 6.45 buffer of synthetic urine.
CRP: C-reactive protein; SST: Specific signal threshold.

