Figure 5.
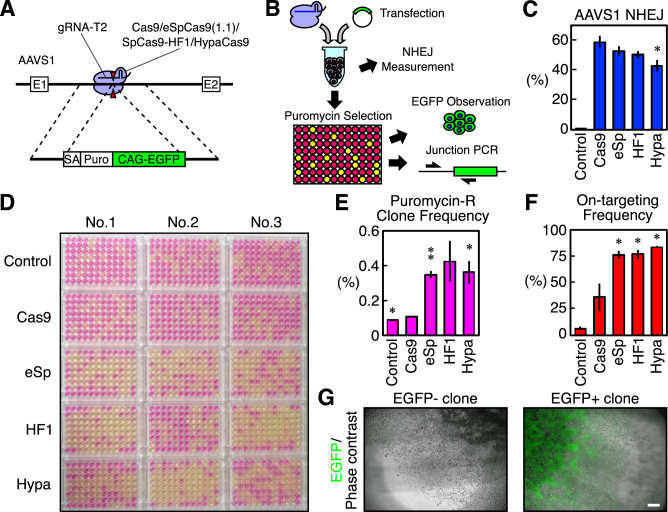
Knock-in of a DNA fragment into AAVS1 via HDR induced by Cas9 and the Cas9 variants in HEK293T cells. (A) A schematic representation of the AAVS1 targeted with an approximately 4.2-kb cassette of a puromycin-resistant gene and EGFP driven by the CAG promoter. Cas9 and the Cas9 variants combined with the AAVS1 gRNA-T2 were used. (B) A schematic representation of transfection and an analysis of the cells. HEK293T cells were reverse transfected with a plasmid for the dual expression of Cas9 or a Cas9 variant and a gRNA, and the targeting donor plasmid. Half of the transfected cells were used to monitor NHEJ by ddPCR. The other half of the cells were plated in a 96-well plate and selected for puromycin-resistant cells. The survival of the cells in each well was monitored by the color change induced by the presence of phenol-red in the media. The surviving cells were analyzed by EGFP observation and 5′ junctional PCR for the correct integration of the fragment. (C) The NHEJ activities of Cas9 and the Cas9 variants at AAVS1. The frequencies of the NHEJ alleles among the total alleles±S.E. analyzed by ddPCR are shown (n = 3). Student's t-test was used to evaluate the difference between WT Cas9 and the Cas9 variants or the control. *P< 0.05. (D) The color of the media in the 96-well plates after puromycin selection. (E) The frequencies of HEK293T cells that acquired puromycin-resistance. The values ± S.E. are shown (n = 3). Student's t-test was used to evaluate the difference between WT Cas9 and the Cas9 variants or the control. *P< 0.05 and **P< 0.01. (F) The frequencies at which a well containing puromycin-resistant cells was also positive on 5′ junctional PCR for the correct targeting. The values ± S.E. are shown (n = 3). Student's t-test was used to evaluate the difference between WT Cas9 and the Cas9 variants or the control. *P< 0.05. (G) Examples of puromycin-resistant cells that were negative and positive for EGFP. More than 87% of the wells positive on junctional PCR were also positive for EGFP, and we noted no significant differences in this frequency between WT Cas9 and the Cas9 variants (see also Supplementary Figure S6D). The scale bar is 300 μm. The two images are shown at the same scale.

