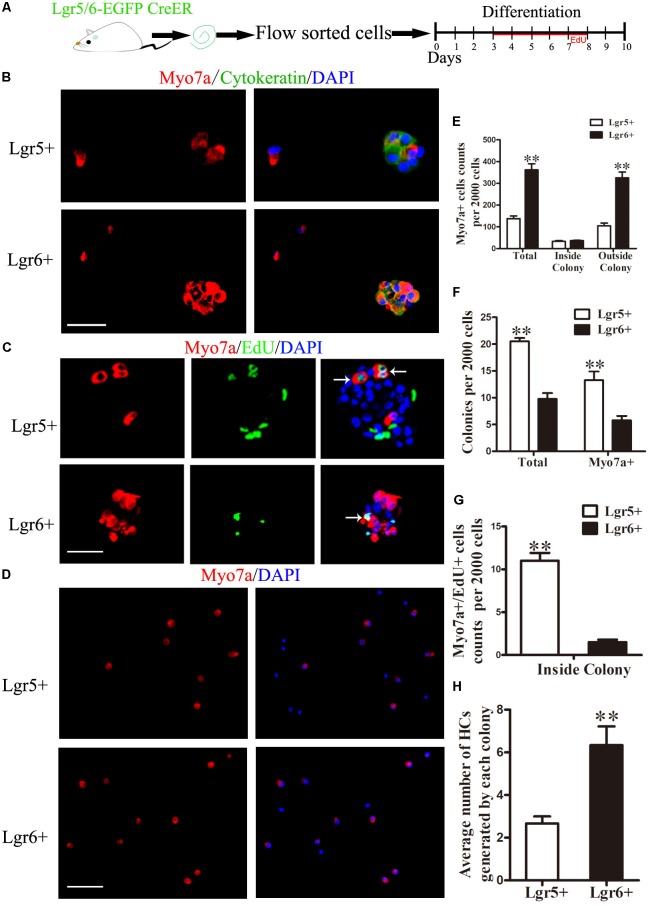
FIGURE 2.
Lgr6+ progenitors generate more HCs compared to Lgr5+ progenitors in vitro. (A) Schematic depicting the experimental process. We dissected the cochleae and then cultured the sorted GFP+ cells at 20 cells/μl for 10 days. (B) Both Lgr5+ and Lgr6+ progenitors could generate Myo7a+ colonies. (C) Both Lgr5+ and Lgr6+ progenitors could generate Myo7a+/EdU+ cells inside of the colonies. (D) Both Lgr5+ and Lgr6+ progenitors could generate Myo7a+ cells outside the colonies. (E) The total number of Myo7a+ cells in each well per 2,000 cells and the numbers of Myo7a+ cells inside and outside the colonies. The Lgr5+ progenitors formed around 140 Myo7a+ cells per 2,000 cells and about 33 Myo7a+ cells inside the colonies, while the Lgr6+ progenitors formed around 360 Myo7a+ cells per 2,000 cells and about 36 Myo7a+ cells inside the colonies. (F) The numbers of colonies in each well per 2,000 cells. The Lgr5+ progenitors formed around 20 colonies and 10 Myo7a+ colonies, while the Lgr6+ progenitors formed around 13 colonies and 6 Myo7a+ colonies. (G) Lgr5+ progenitors generated significantly more Myo7a+/EdU+ cells than Lgr5+ progenitors inside of the colonies (11.0 ± 0.91 and 1.5 ± 0.29 HCs, respectively). (H) Each Myo7a+ colony from the Lgr6+ progenitors generated significantly more HCs than the Myo7a+ colonies from Lgr5+ progenitors. ∗∗p < 0.01, n = 4. Scale bars are 20 μm.

