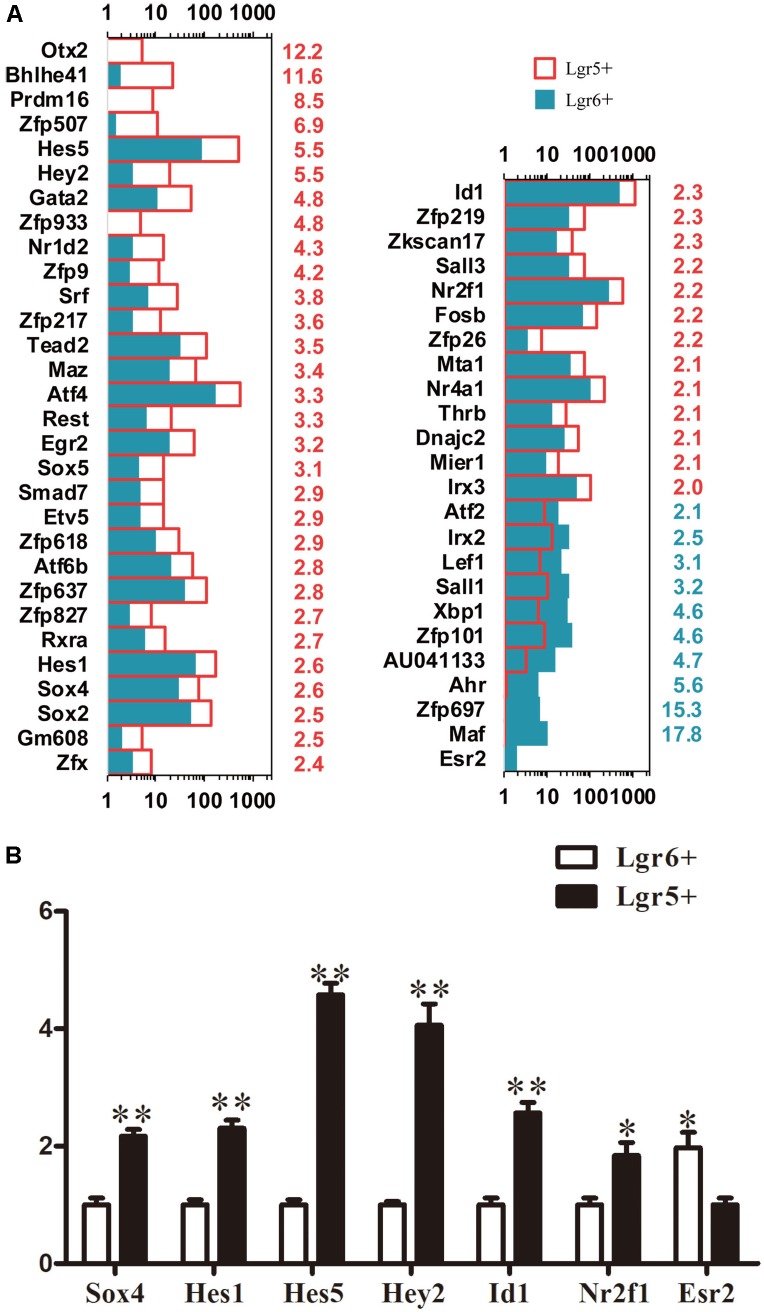
FIGURE 5.
Genes regulating transcription factors. (A) Expression levels of differentially expressed TFs. The number in red on the right of each panel represents the fold difference in expression in Lgr5+ progenitors versus Lgr6+ progenitors, and the number in blue on the right of each panel represents the fold difference in expression in Lgr6+ progenitors versus Lgr5+ progenitors. (B) q-PCR analysis of the TF genes. ∗p < 0.05, ∗∗p < 0.01, n = 3.

