
Figure 11.
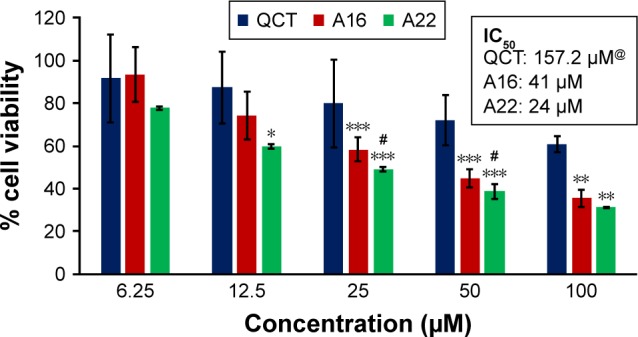
In vitro cytotoxicity of QCT, A16, and A22 in MDA-MB-231 cells after 72 h of incubation by MTT assay. Values are mean ± SD (n=3). *P<0.05, **P<0.01, ***P<0.001 versus QCT treatment at the same dose; #P<0.05 versus A16 treatment at the same dose; A16, mixed polymeric micelles of P123/P407 (7:3 molar ratio) containing QCT; A22, mixed polymeric micelles of P123/P407/TPGS (7:2:1 molar ratio) containing QCT; @, QCT was also screened at higher doses to determine IC50 (data not shown in figure).
Abbreviations: IC50, concentration which inhibited 50% growth; QCT, quercetin; TPGS, tocopheryl polyethylene glycol succinate.