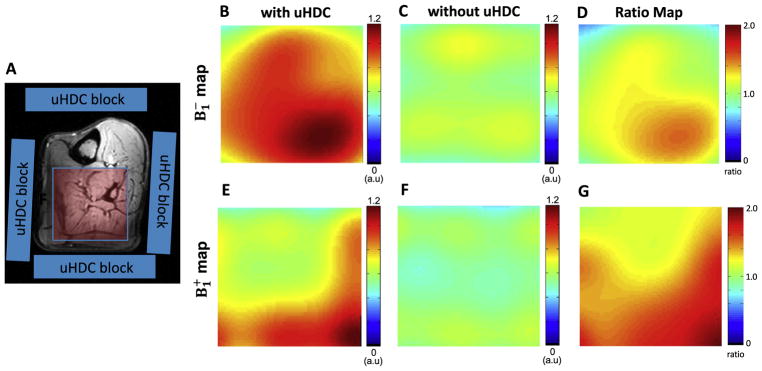
Fig. 5.
Comparison of 31P B1 maps (in the axial plane) of selected human calf muscle (left panel) in another subject. (A) shows the schematic placement of 4 uHDC blocks (blue) around the leg. The B1 maps (the scale bar is in an arbitrary unit, a.u.) with the uHDC blocks (B, E) show large enhancement of B1 efficiency compared to the case without the uHDC blocks (C, F). The B1 ratio maps (D, E) represent the B1 with uHDC over B1 without uHDC.

