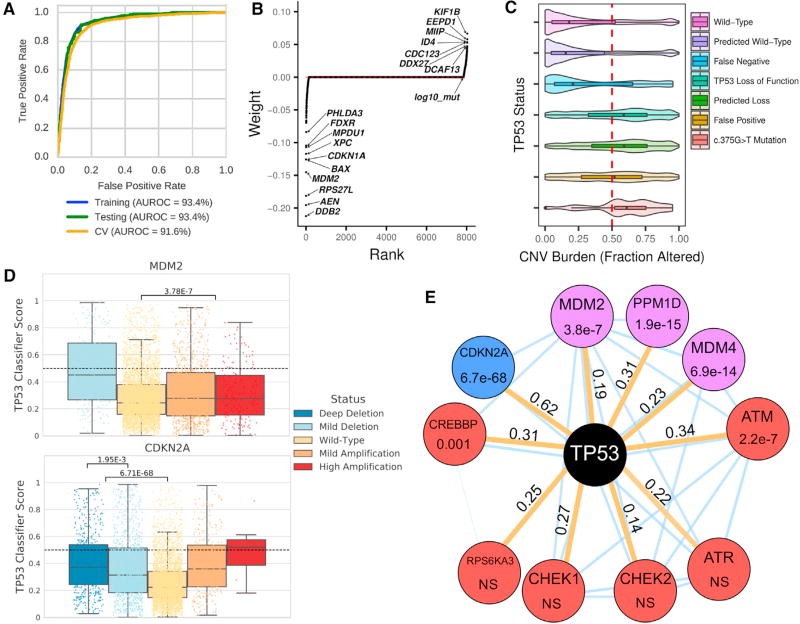
Figure 5. Machine Learning to Predict TP53 Inactivating Mutations in Cancer.
(A) Robust classifier performance by receiver operating characteristic (ROC) and area under the ROC curve (AUROC). Training data, cross validation assessment, and held out test set (10%) for 19 cancer types were used.
(B) Model-derived gene weighting. Classifier weights indicate individual gene influence on classification accuracy. Negative weights indicate increased gene expression in TP53 wild-type samples.
(C) SCNA burden is correlated with known/predicted TP53 status. Plots show SCNA/CNV burden as fraction altered for known or predicted TP53 status. The SCNA profile for TP53 mutation c.375G>T in TP53 exon 4 appears similar to other TP53 loss events.
(D) SCNA in TP53-interacting genes MDM2 and CDKN2A phenocopies TP53 loss. Results shown are for PanCanAtlas TP53 wild-type samples.
(E) TP53 network gene alterations phenocopy TP53 deficiency. Mutations were manually curated and selected a priori. All mutation tests including only TP53 wild-type/non-hypermutated cancers are indicated by orange edges. Node color indicates event class (red, mutation; blue, copy-number loss; and purple, copy-number amplification); edge values indicate Cohen’s d effect size. Thin blue edges indicate predicted interactions from the STRING database. NS is “not significant” with p > 0.005. See also Figure S6.

