
Figure 4. Kaplan-Meier Curves Comparison.
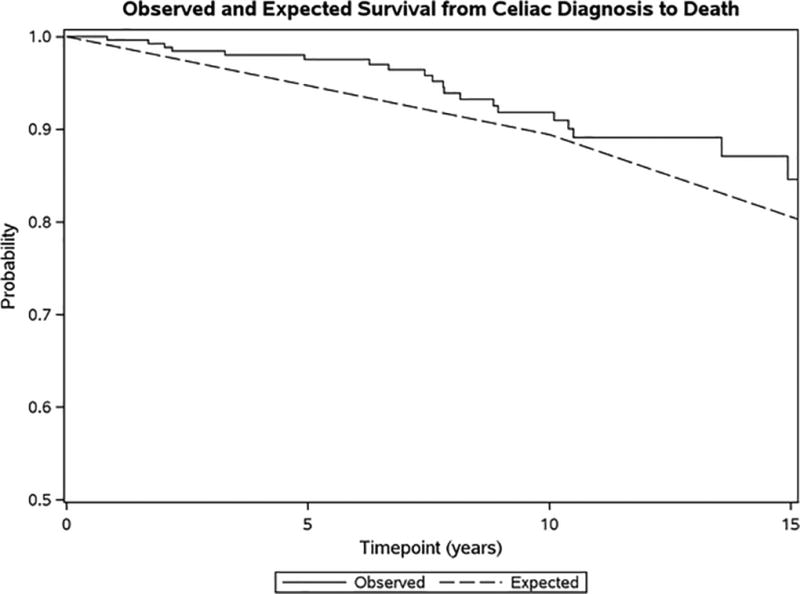
Compares observed versus expected survival in the cohort of patients with diagnosed celiac disease compared to controls (Minnesota white population).
Official websites use .gov
A
.gov website belongs to an official
government organization in the United States.
Secure .gov websites use HTTPS
A lock (
) or https:// means you've safely
connected to the .gov website. Share sensitive
information only on official, secure websites.
Compares observed versus expected survival in the cohort of patients with diagnosed celiac disease compared to controls (Minnesota white population).