Figure 4.
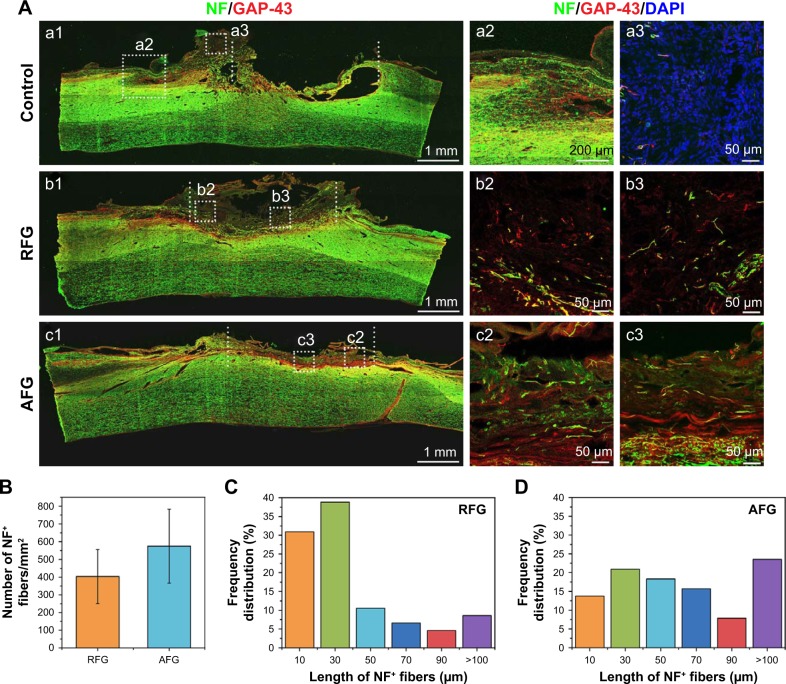
Nerve regeneration in the dorsal hemisected site at 8 weeks after surgery. Shown in Figure 5A, (a1–c1) are the immunofluorescence staining images of T8–T10 sagittal sections with NF (green), GAP43 (red), and DAPI (blue). Higher magnification images of the areas circled by the dotted white squares in the left images are shown in the right columns ([a2–a3], [b2–b3] and [c2–c3], respectively). The quantification of NF-positive fibers at the injury site is shown in (B), (C), and (D): (B) the density of NF-positive fibers at the injury site; the frequency distribution of NF-positive fibers of RFG (C) and AFG (D). Four individual rats per group were used for statistical analysis (n = 4), and five confocal images per rats were used for the NF-positive fiber counts and length calculation.
Abbreviations: AFG, aligned fibrin hydrogel; DAPI, 4′,6-diamidino-2-phenylindole; NF, neurofilament; RFG, random fibrin hydrogel.

