Figure 5.
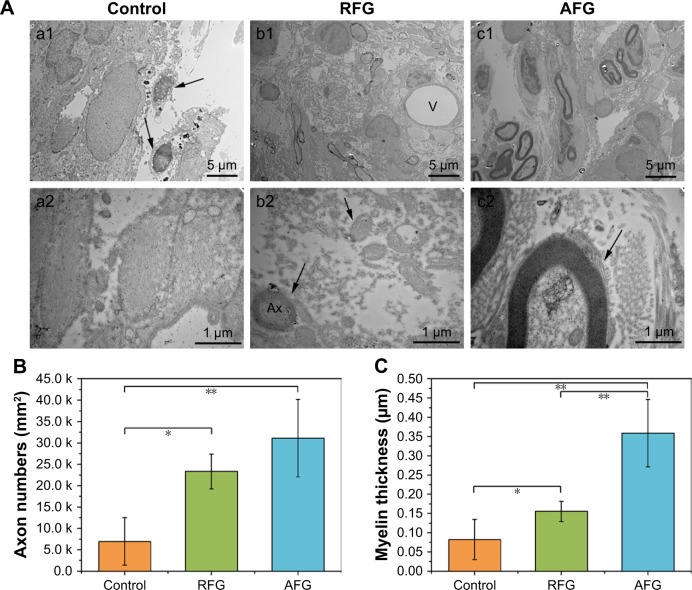
Transmission electron micrographs of the middle lesion site. (A) (a1–a2) Axons with loose myelin sheaths and abundant collagen regenerated in the area of lesion site in the control group; compared to the control group, a great deal of myelinated axons with relatively compact myelin sheaths (Ax) are seen in the middle region of lesion site (c1–c2), and accompanying blood vessels (V) in the RFG group (b1–b2). The arrows show the axons. (B and C) The number and myelin thickness of axons in the middle lesion site are summarized and analyzed. Data are expressed as mean ± standard deviation. Statistical comparisons were performed using ANOVA, and *p < 0.05, **p < 0.01. Four individual rats per group were used for statistical analysis (n = 4), and five TEM images per rat were used for the axon counts and myelin thickness calculation.
Abbreviations: AFG, aligned fibrin hydrogel; ANOVA, analysis of variance; RFG, random fibrin hydrogel; TEM, transmission electron microscopy.

