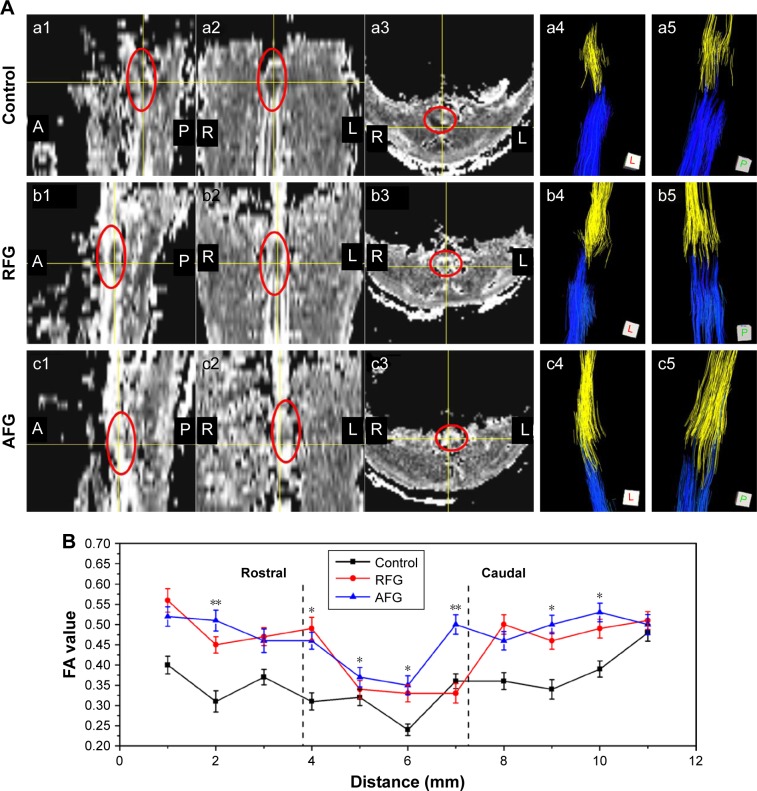
Figure 6.
Representative FA maps, tractography images, and FA values of the spinal cord at 16 weeks after the implantation. (A) The bright region indicates high anisotropy in the representative FA maps (a1–a3, b1–b3 and c1–c3, where A, P, L, and R represent anterior, posterior, left, and right, respectively). In the images of (a4–a5), (b4–b5), and (c4–c5), yellow stands for fibers traced from the ROI rostral to the epicenter, where blue corresponds to fibers traced from the ROI caudal to the epicenter. (B) FA value versus location (mm) reveals statistically significant differences between the AFG group and the RFG group at the lesion site (n = 4), *p < 0.05, **p < 0.01. Furthermore, the FA value of AFG revealed statistically significant differences from control group animals at all locations along the spinal cord (p < 0.01).
Abbreviations: AFG, aligned fibrin hydrogel; FA, fractional anisotropy; RFG, random fibrin hydrogel; ROI, region of interest.

