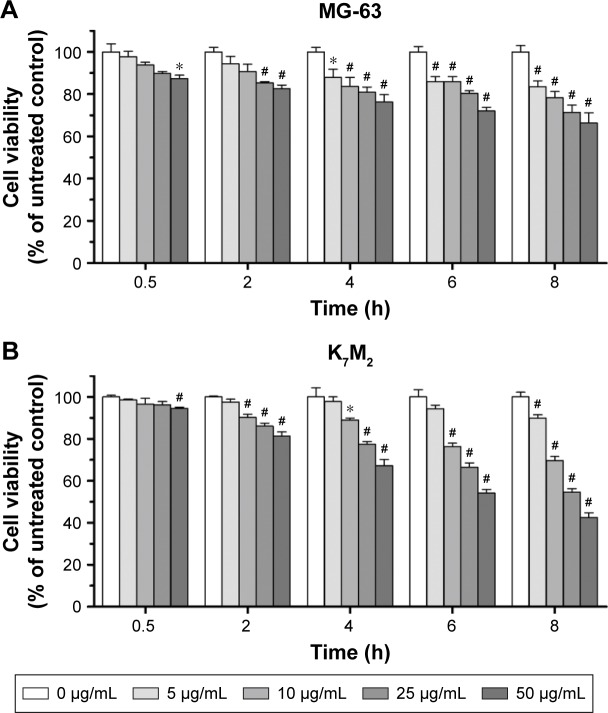
Figure 1.
The cytotoxic effect of GO on MG-63 and K7M2 cells. (A) MG-63 and (B) K7M2 cells were exposed to varying concentrations of GO for different treatment periods (without FBS).
Notes: The effects on cell viability were determined using an MTT assay with GO (0–50 µg/mL) treatment for 0.5–8 h. Cell viability was calculated as a percentage of untreated cells (100%) and compared with untreated control. Values are presented as mean±SD (*P<0.05, #P<0.01).
Abbreviations: FBS, fetal bovine serum; GO, graphene oxide.

