
Figure 4.
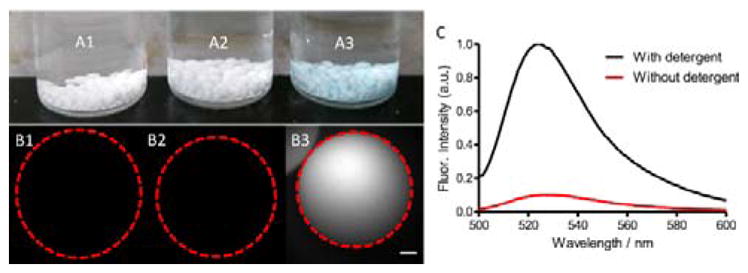
(A) Photograph of three vials containing cationic beads treated with (A1) buffer, (A2) POPC@CSP, and (A3) POPC@CSP⊃6C. (B) Fluorescent micrographs (Ex: 635–675 nm, Em: 696–736 nm) showing an individual bead from each of the corresponding samples in A. Red dashed line denotes bead perimeter. Scale bar is 100 μm. (C) Fluorescence spectra (ex: 490 nm) of supernatant from a sample of beads coated with POPC@CSP⊃6C liposomes containing fluorescent rhodamine 123, before (red) and after (black) lysis of the adhered liposomes with detergent.