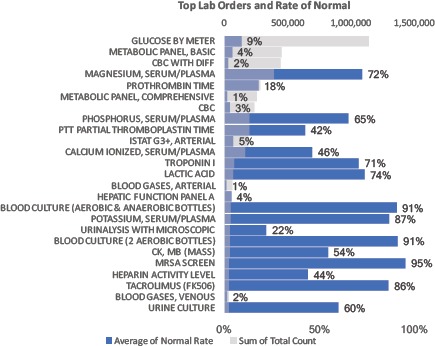
Figure 1a.

Top 25 most prevalent lab orders 2009-2014. Quantity noted by gray bars. Blue bars and data labels reflect percent of lab orders yielding all “Normal” = “In Range” results. For example, over there were over 1,000,000 orders to check a patient’s Glucose by Meter, with 9% of such test yielding a value in the normal range.
