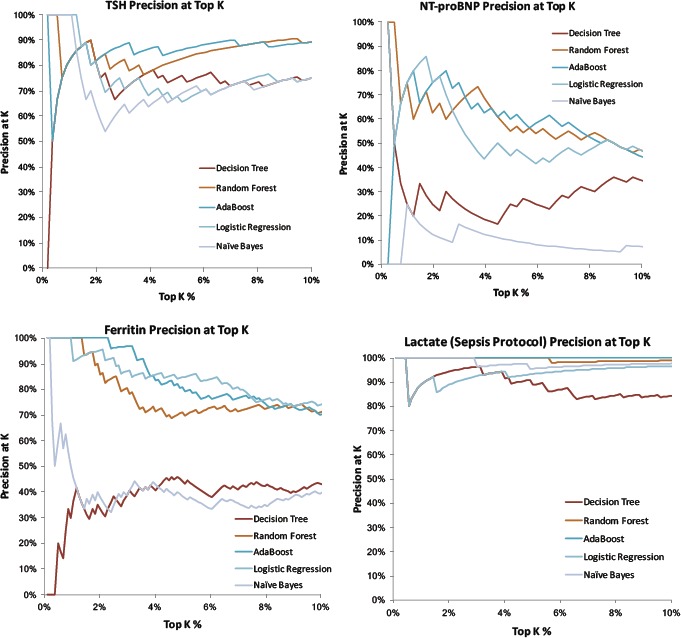
Figure 3.

Top 10% tail distribution of several example lab results based on how likely they are to yield “normal” results as predicted by machine learning methods. Curves plot the precision (positive predictive value) = rate of normal lab results when assessing only the top K% of results). For many methods and many labs, the top few percent of lab results are essentially 100% predictable to be normal given existing data. Example hyperparameters illustrated: Decision Tree Max Depth = 20, Random Forest 30 Estimators with Max Depth =5, AdaBoost with 50 Estimators and Learning Rate = 0.1, Logistic Regression with Regularization C = 1.0, and Gaussian Naïve Bayes).
