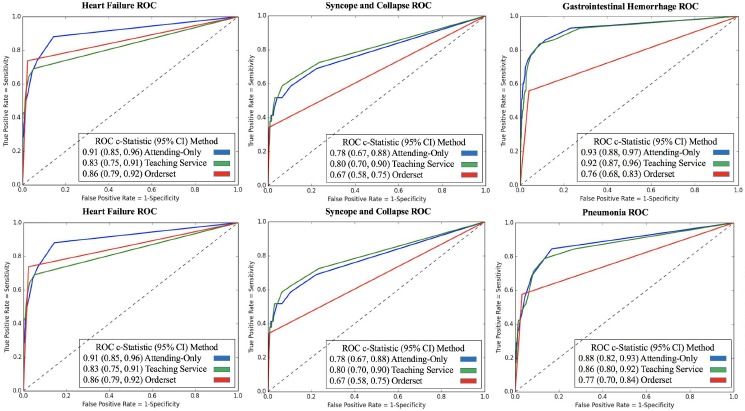
Figure 2.

ROC plots for the 6 common diagnoses. Each plot compares an order set authored by the hospital and automated predictions from attending-only and teaching service association models against the guideline reference standard. In all cases excluding heart failure, both model-predicted order lists show substantially larger c-statistics than the respective order set benchmark. As the manually-curated hospital order set has no inherent ranking, it is plotted as a single point in which all order set items are considered.
