
Figure 4. FIGURE 4: Mitochondrial membrane potential.
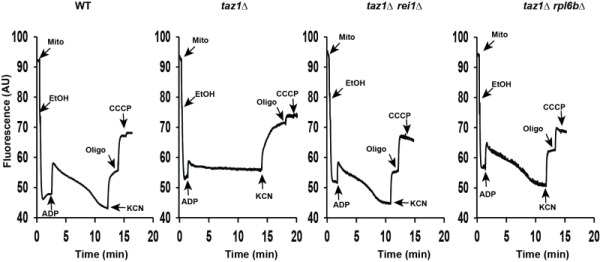
Variations in mitochondrial ΔΨ were monitored by fluorescence quenching of Rhodamine 123, using intact, osmotically-protected, mitochondria isolated from WT, taz1Δ, taz1Δ rei1Δ and taz1Δ rpl6bΔ cells grown in CSM containing 0.5% galactose + 2% ethanol at 36°C until a density of 2-3 OD600nm. The additions were 75 μM ADP, 0.5 μg/ml Rhodamine 123, 75 μg/ml mitochondrial proteins (Mito), 10 μl ethanol (EtOH), 2 mM potassium cyanide (KCN), 4 μM CCCP (carbonyl cyanide-m-chlorophenyl hydrazone) and 4 μg/ml oligomycin (oligo). The shown tracings are representative of four experimental trials. The data for WT and taz1Δ strains were reported previously 60.