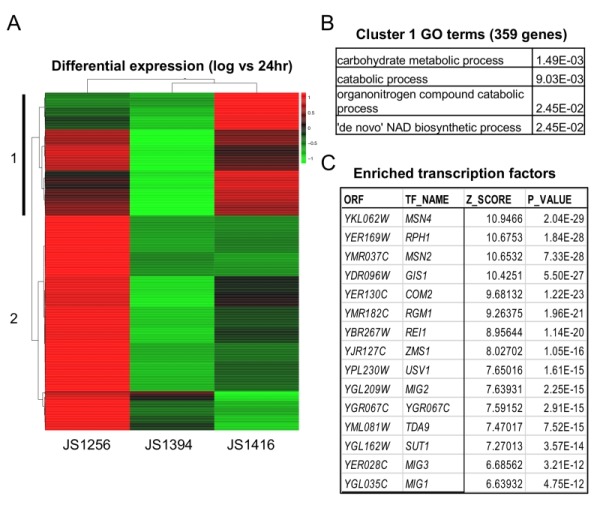
Figure 6. FIGURE 6: RNA-seq analysis of gene expression in WT, snf1∆, and bypass suppressor strains.

(A) Genes (986) that were upregulated at 24 hr in the WT strain (JS1256), but not in the snf1∆ strain (JS1394) were analyzed by Pearson correlation clustering and displayed as a heat map of Z-score from the mean of all three strains. Cluster 1 (vertical black bar) represents 359 genes in which expression was restored in JS1416 compared to JS1394.
(B) Gene ontology (GO) terms and p-values associated with cluster 1 using Holm-Bonferroni correction.
(C) Top 15 enriched transcription factors on the promoters of genes with >2-fold enrichment in JS1416 compared to JS1394 (from Supplemental Table S1).
