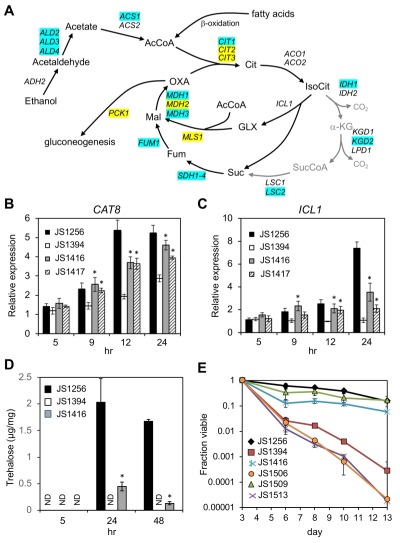
Figure 7. FIGURE 7: Reactivation of CAT8 and the glyoxylate/gluconeogenesis pathways in adapted snf1∆ mutants.

(A) Diagram of ethanol and fatty acid catabolism through the TCA and glyoxylate cycles, leading to gluconeogenesis. Genes involved in each enzymatic step are listed, including the first step of gluconeogenesis (PCK1). Blue shading indicates restored expression in the suppressor strain (JS1416) at 24 or 48 hr based on RNA-seq analysis. Yellow shading indicates restored expression only at 48 hr. Abbreviations: Cit, citrate; IsoCit, isocitrate; GLX, glyoxylate; Mal, malate; OXA, oxaloacetate; α-KG, α-ketoglutarate; SucCoA, succinyl CoA; Fum, fumarate.
(B) Quantitative RT-PCR of CAT8 expression when entering the diauxic shift.
(C) Quantitative RT-PCR of ICL1 expression during the same time course.
(D) Trehalose measurements from WT (JS1256), snf1∆ (JS1394), and suppressor (JS1416) cells growing in liquid SC media, and then harvested at log phase (5hr), 24hr, or 48 hr.
(E) Quantitative CLS assay showing that lifespan extension in the snf1∆ cyc8-G337S bypass mutant is fully dependent on CAT8. The strains are JS1256, WT; JS1394, snf1∆; JS1416, snf1∆ cyc8-G337S; JS1506 snf1∆ cyc8-G337S cat8∆; JS1509, cat8∆; JS1513, snf1∆ cat8∆. Error bars in each experiment indicate standard deviation of the mean viability for 3 biological replicates. For qRT-PCR analysis, significant expression increases in the adapted mutants over the snf1∆ parent are indicated by an asterisk (p<0.05, one-tailed t-test).
