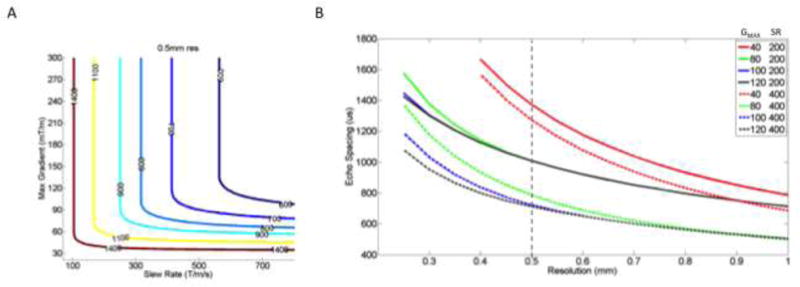
Figure 2.

A) Plots of constant ES (color) achieved with different slew rates and maximum gradients. The lower left bend in each curve shows the minimally required Gmax and SR to achieve the ES in EPI at 0.5 mm resolution. Evaluation of curves allows optimization of gradient hardware performance as higher maximum gradients do little to reduce ES without concurrent increases in SR. (Optimization curves for other spatial resolutions are given in Supplemental Figure 1)
B) – The graph shows ES vs resolution using different performance of gradient hardware systems shown in legend (Gmax, SR). Color shows different Gmax. The solid and dashed lines show SR =200 and SR=400 mT/m/ms, respectively. To obtain 0.5 mm resolution with (80,200) performance gradient system requires ES =1100 us whereas (100, 400) performance achieves ES =750us allowing for an earlier effective TE and reduced image distortions. (Supplemental material shows similar plots 0.3 mm and 0.4 mm resolutions)
