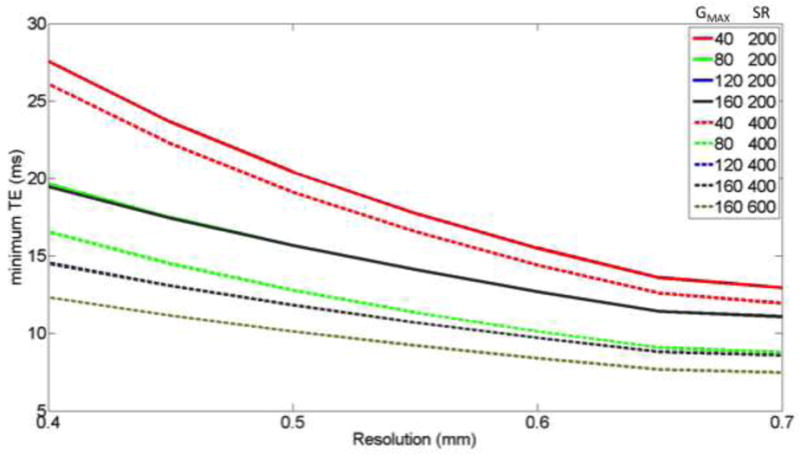
Figure 3.

– The effect of resolution on minimum TE with different gradient performances (color) GMAX, slew rate. These TE calculations used partial Fourier 5/8 and R-factor 2 acceleration and imaging parameters described in text. (Supplemental material shows use of other R and pF values.)
