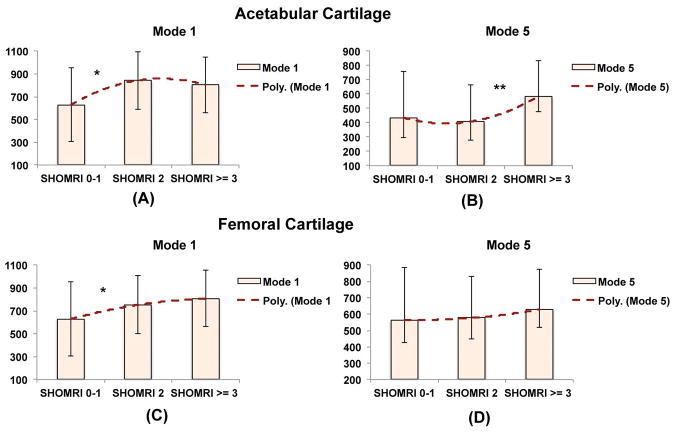
Figure 2.
Comparison of the values in mode 1 and mode 5 in subject with SHOMRI <2, SHOMRI =2, SHOMRI > 2 in acetabular (A–B) and femoral (B–C) cartilage * p-value<0.05, p value < 0.005. The y-axis in this bar graph represents the value of the shape modes 1 and 5. These are a-dimensional numbers representing the projection of each bone shape (described as a point in a multidimensional space where each dimension is one of the coordinate of each mesh’s vertex) on the corresponding principal component basis.

