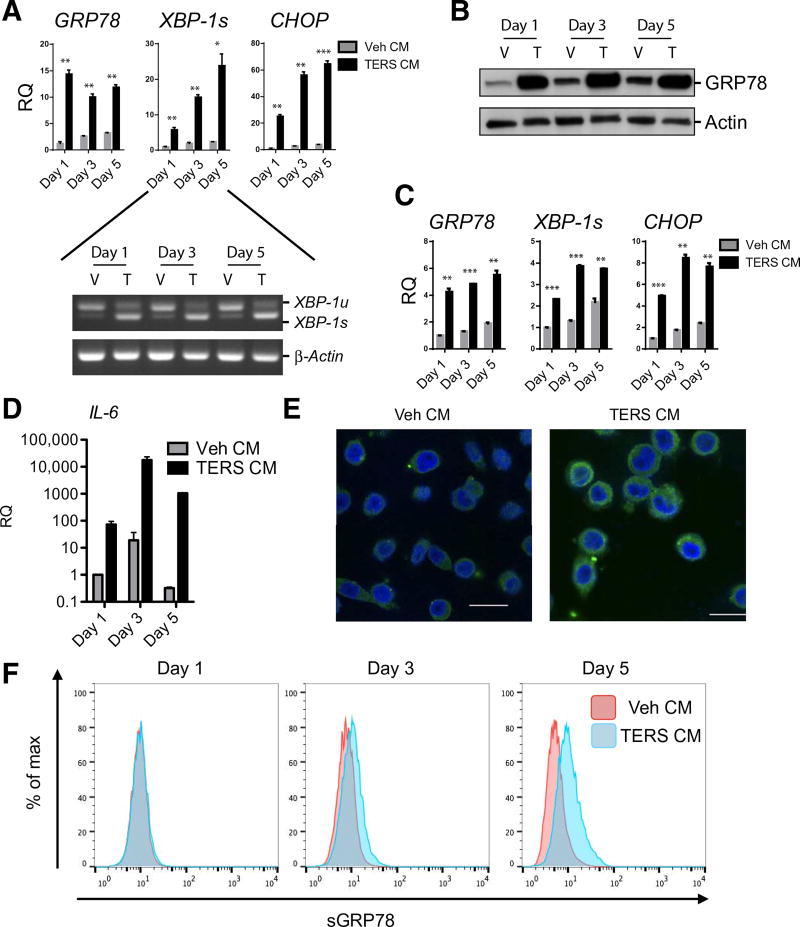
Fig. 1. Prostate cancer cells undergoing ER stress can transmit an ER stress response to recipient cells.
(A) Expression of the indicated mRNA (by RT-qPCR) in PC3 cells cultured for 1, 3, or 5 days in Veh CM or TERS CM (n = 2 per condition). Gene expression was normalized to Veh CM day 1. RQ, relative quantification. Inset shows gel banding for unspliced (XBP-1u) and spliced (XBP-1s) XBP-1. (B) Western blot analysis for GRP78 abundance in whole-cell lysates from PC3 cells cultured as described in (A). V, Veh CM; T, TERS CM. (C) RT-qPCR in DU145 cells as described in (A) treated with PC3 generated Veh CM or TERS CM (n = 2 per condition). Gene expression was normalized to Veh CM day 1 condition to determine relative quantification. (D) RT-qPCR analysis for IL-6 expression in PC3 cells cultured with Veh CM or TERS CM as described in (A). Values are normalized to Veh CM day 1 (n = 2 per condition). (E) Confocal microscopy for GRP78 in Veh CM– or TERS CM–treated PC3 cells for 48 hours. Scale bars, 25 µm. (F) Flow cytometry analysis of surface abundance of GRP78 (sGRP78) in Veh CM– or TERS CM–cultured, unpermeabilized PC3 cells. Data are means ± SEM; *P < 0.05, **P < 0.01, ***P < 0.001, paired two-tailed Student’s t tests. Data in (C) to (E) are representative of two experiments; data in (A), (B), and (F) are from three independent experiments.

