
Figure 1. Three BMI trajectory classes from pre-adolescence to early adulthood.
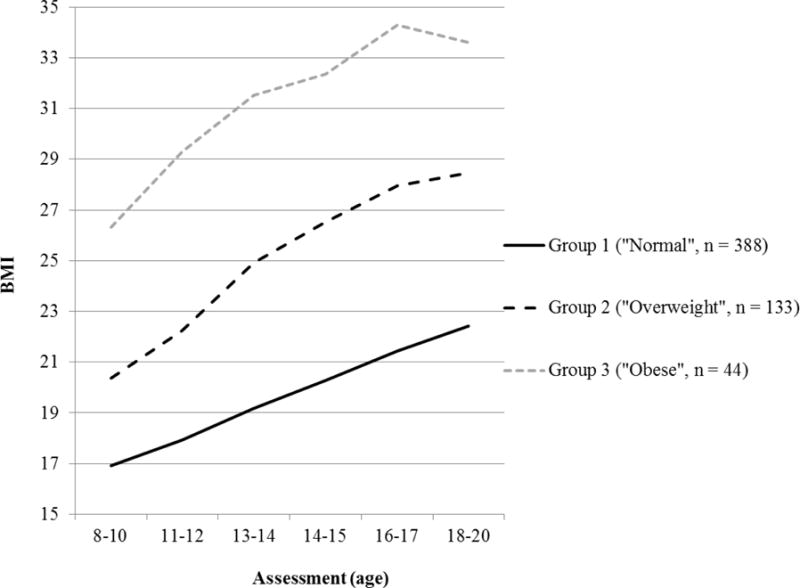
Note. Group 1, “normal”, n = 388 (69%); Group 2, “overweight”, n = 133 (24%); Group 3, “obese”, n = 44 (8%). Bayesian Information Criterion = 7812.46, entropy = .84, Lo–Mendell–Rubin adjusted Likelihood Ratio test = 181.20 (p = .06), and average latent trajectory probabilities for most likely latent class membership = .83–.96.