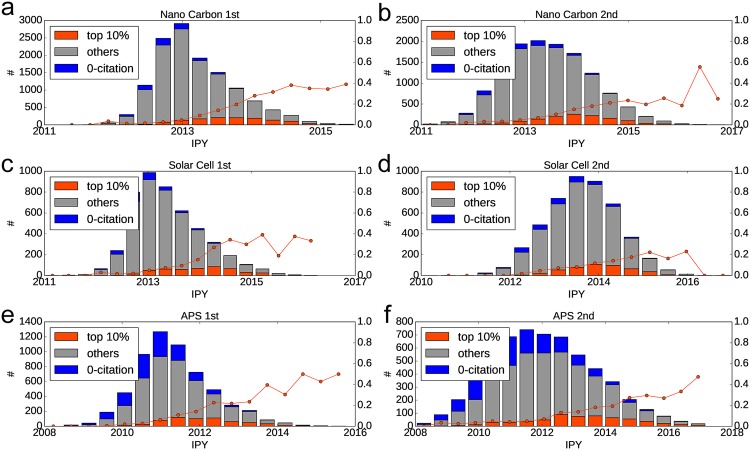
Fig 3. Distribution of IPY in set 0-citation, top 10% future citation, and other papers.
The blue line (secondary axis) corresponds to the ratio of future top 10%cited papers in each bin. (a,b) Results of nanocarbon using (a) LINE 1st and (a) LINE 2nd. (c,d) The same plot of Solar cells and (e,f) APS.

