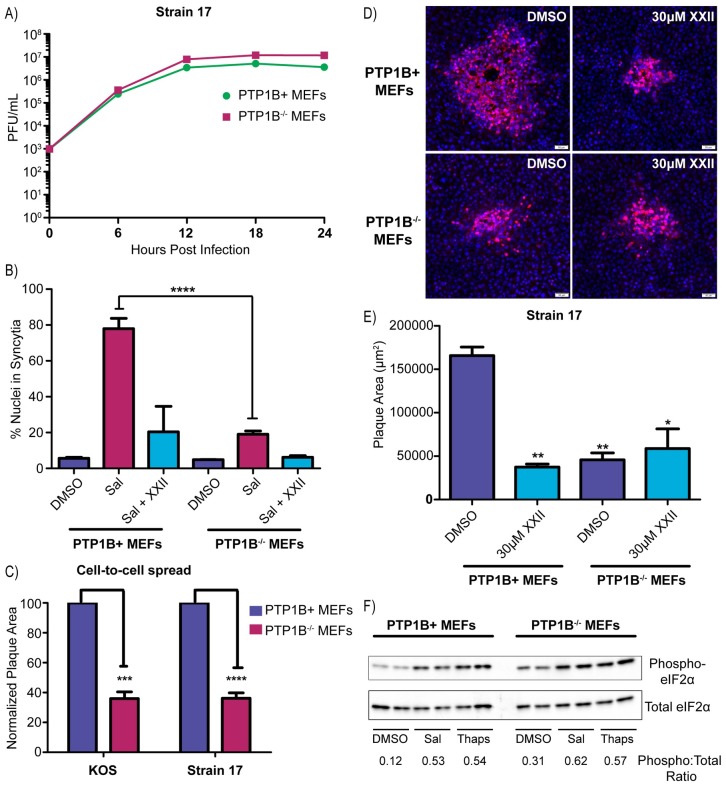
Fig 7. HSV-1 cell-to-cell spread is limited in PTP1B-/- MEFs.
(A) Virus replication assays were performed in PTP1B+ and PTP1B-/- MEFs infected with strain 17 (MOI = 5). At 6-hour time points, duplicate samples were collected for measurements of the virus titers (cell lysate + medium), which were averaged and plotted. (B) To measure syncytia formation, PTP1B+ MEFs or PTP1B-/- MEFs were infected (MOI = 3) with strain 17 and treated with DMSO, 50 μM salubrinal, or 50 μM salubrinal + 30 μM inhibitor XXII. At 24 hpi, cells were immunostained for ZO-1 and DAPI-stained nuclei in syncytia were manually counted. 1000 nuclei were scored per image, and 2 replicates were averaged. (C) To assay for cell-to-cell spread, PTP1B+ MEFs or PTP1B-/- MEFs were infected (100 PFU/well) with strains KOS or 17, and the cells were incubated in medium containing 5 mg/ml pooled IgG. At 42 hpi, the cells were immunostained for VP5, and the areas of 10–15 plaques per sample were measured. Data are represented as mean ±SD from 3 independent experiments. A student T-test was used to determine statistical significance for the PTP1B-/- samples compared to the PTP1B+ control. (D and E) PTP1B+ MEFs or PTP1B-/- MEFs were infected with strain 17 (100 PFU/well) and incubated in medium containing 5 mg/ml of pooled human IgG along with either DMSO or 30 μM inhibitor XXII. At 42 hpi, cells were immunostained for VP5. (D) Representative plaques are shown. (E) To quantify the results, 10–15 plaques per sample were measured, and the mean plaque area was plotted from 2 independent experiments. A student T-test was used to determine statistical significance for samples compared to the PTP1B+ DMSO control. (F) To ascertain their ability to respond to salubrinal, uninfected PTP1B+ MEFs or PTP1B-/- MEFs were incubated in medium containing DMSO, 50 μM salubrinal, or 1 μM thapsigargin for 2 hours. Cell lysates were harvested in the presence of phosphatase inhibitors and probed via western blotting for total eIF2α and phosphorylated eIF2α. Duplicate samples were analyzed in the same western blot and band intensities were quantified.

