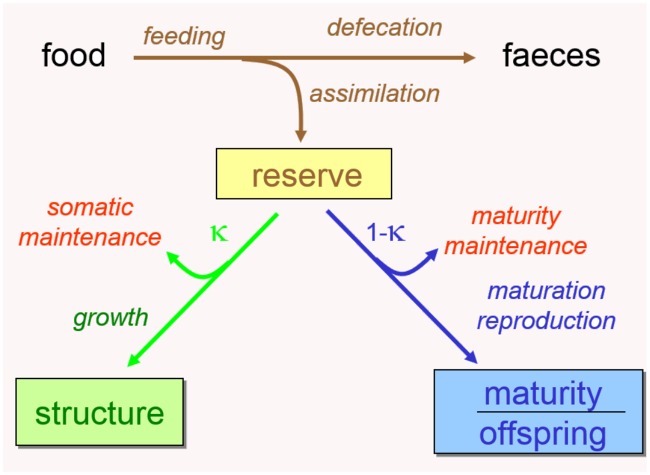
Fig 1. Model scheme of the standard DEB model.
Boxes: state variables. Arrows: mass/ energy fluxes associated with each of the processes specified on the scheme. Each process is quantified by a model parameter (see Table 1). The only process that is not represented here is aging, which is quantified by two parameters.

