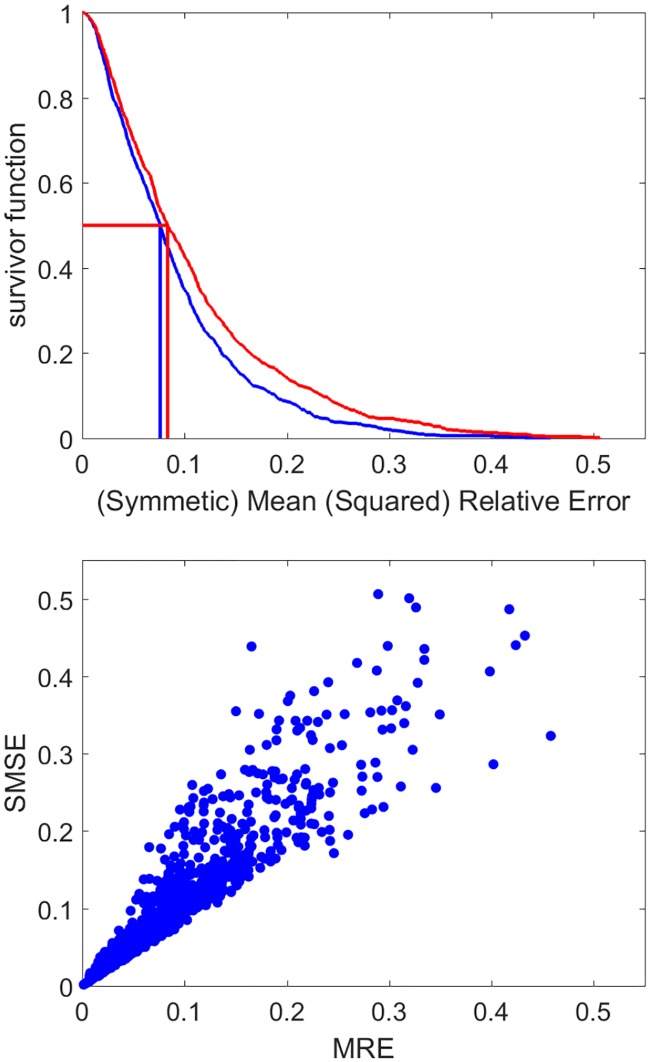
Fig 4. Goodness of fit of the DEB model to empirical data in the AmP collection: The survival function of MRE (blue) and SMSE (red), with their median values and the relationship between MRE and SMSE.
See Methods for the definition of the MRE and SMSE.

