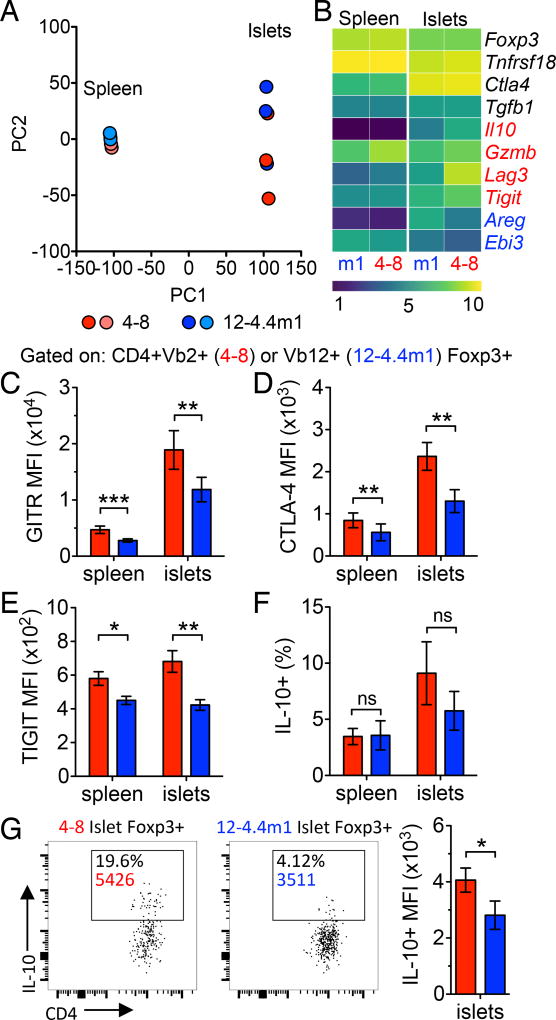
Figure 4.
High and low affinity Tregs are transcriptionally distinct. (A) Principle component analysis of 4–8 and 12-4.4m1 Tregs isolated from the spleens and islets of wt/wt two-TCR Rg BM chimeras (n=3). (B) rlog transformed heatmap of Treg functional genes (n=3). Genes in black had no statistical difference between 4–8 and 12-4.4m1 Tregs in the islets. Red (increased in 4–8 Tregs) and blue (increased in 12-4.4m1 Tregs) genes had a significant q-value (q<0.05) between 4–8 and 12-4.4m1 Tregs in the islets. (C) GITR MFI (n=16), (D) CTLA-4 MFI (n=7), (E) TIGIT MFI (n=10) and (F) percent IL-10+ (n=7) of 4–8 and 12-4.4m1 Tregs in wt/wt two-TCR Rg BM chimeras. (G) Representative gating of IL-10+ 4–8 and 12-4.4m1 Tregs in wt/wt two-TCR Rg BM chimeras and quantification of IL-10+ MFI (n=7). Mice were analyzed 5–6.5 weeks post-bone marrow transfer. (C–D) Data are pooled from at least 3 independent experiments.

