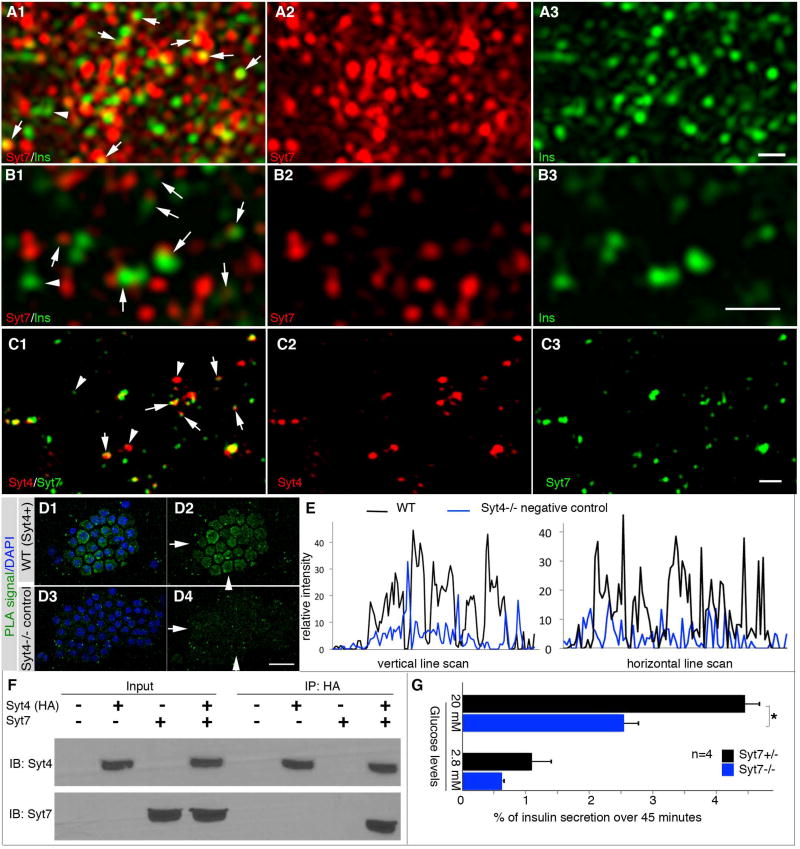
Figure 4. Syt4 co-localizes with Syt7 in β cells.
(A, B) SIM images showing the subcellular localization of Syt7 in a representative adult β cell. Panels A are projections of 8 optical slices taken 125 nm apart. Panel B are single SIM slices for better resolution of Ins/Syt7 localization. Note the large portions of vesicles with overlapping/close localization of Ins/Syt7 (arrows in A1, B1). Also note the vesicles without obvious contact with Syt7 (arrowheads). (C) Co-localization of Syt4 and Syt7 in β cells shown with SIM. Arrows, spots of Syt4-Syt7 co-localization. Arrowheads, spots of single Syt4 or Syt7 signal. The cell identity is confirmed by insulin expression, not included here. Bars=0.5 µm. (D) PLA assays verifying the close localization of Syt4 and Syt7, accepted as indication of direct association. Hand picked islets attached onto slides with cytospin method were used. Images were captured with LSM and Z-stack images were presented to show signals in the entire cell. Note that merged images (D1, D3) between DAPI and PLA signal and single PLA signal images (D2, D4) were shown. Syt4−/− islet cells (D3, D4) were included as negative controls. Arrows and arrowheads in D2 and D4 are the positions of line-scan to compare the relative PLA signal intensity presented in panel (E), in horizontal and vertical directions. Scale bar=20 µm. (F) Immunoprecipitation showing Syt4-Syt7 interactions. Lysates from HEK293 cells transfected with constructs that expressing HA-tagged Syt4 and Syt7 cytoplasmic domains were used. Proteins were immunoprecipitated by anti-HA, then immuno-blotted with anti-Syt7 antibodies. (G) GSIS of P4 Syt7−/− and control immature islets. *: P=0.02, T-tests.

