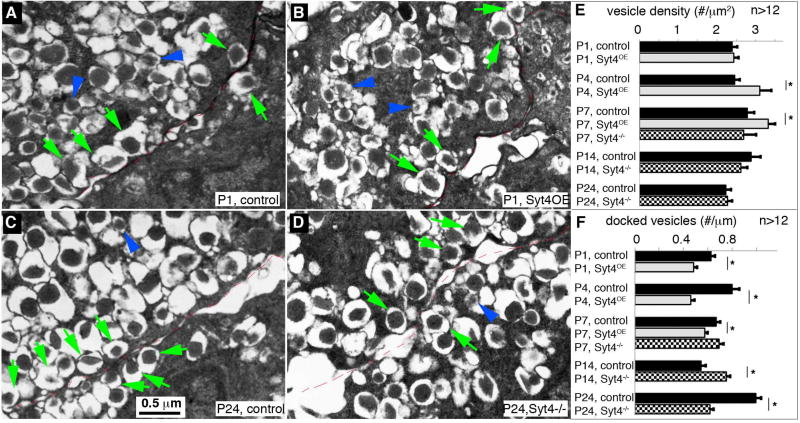
Figure 5. Syt4 regulates insulin vesicle docking to the plasma membrane.
(A–D) Representative TEM images of β cells with Syt4 overexpression or inactivation. (A, B) P1 control and Syt4OE β cells. (C, D) P24 control and Syt4−/− β cells. Green arrows point to several examples of docked mature vesicles. Blue arrowheads point to several immature vesicles, recognized by the low electron density of the insulin core. The cell-cell junctions were outlined with thin broken red lines. (E) Density of vesicles at different stage in islets of control, Syt4OE, or Syt4−/− null mouse β cells. (F) Quantification of docked vesicles in β cells. See Figure S5 for more images used for quantification. *: P<0.05

