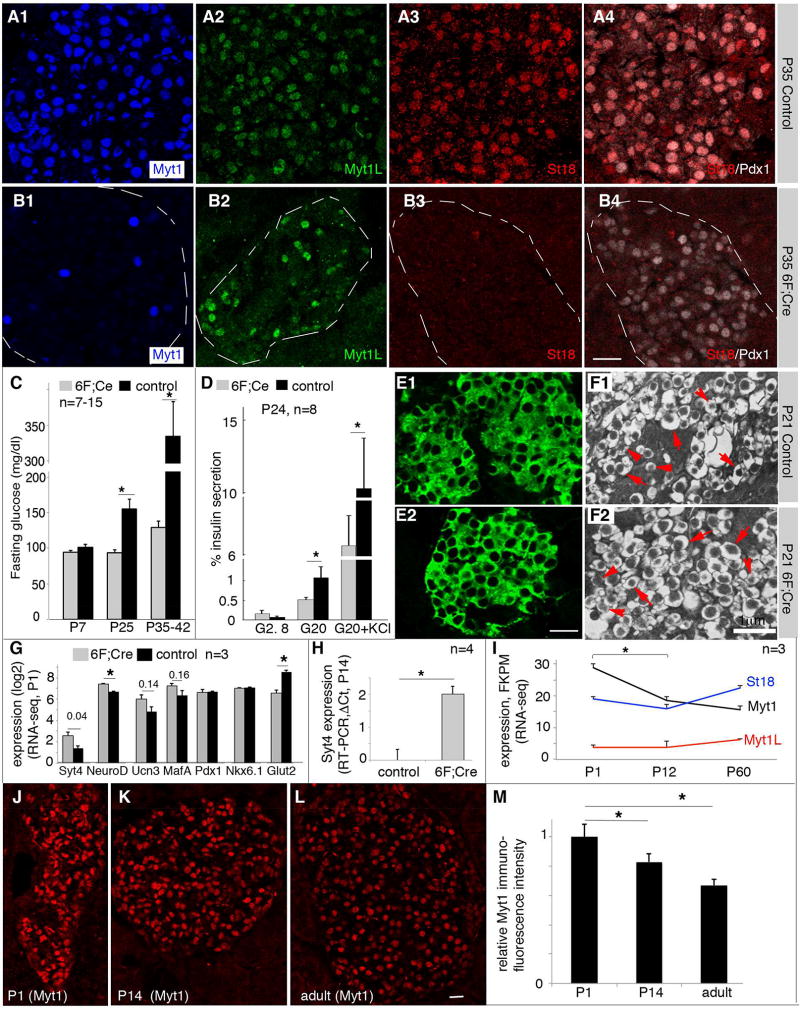
Figure 6. Myt factors repress Syt4 transcription.
(A, B) Myt protein detection in P35 control (con, 6F in this case) and 6F; Cre mutant islets. Note that A4 and B4 showed examples of co-staining of St18 and Pdx1 of panels A3 and B3 to locate the islets, respectively. (C) Fasting glucose in 6F; Cre mutant mice. (D) Islet GSIS and DSIS of weaned mice (P24). (E) Immunofluorescence to show the relative insulin level in P21 control and 6F; Cre β cells. (F) TEM images of insulin secretory vesicles in P21 control and 6F; Cre β cells. Arrows, examples of mature insulin vesicles. Arrowheads, examples of immature vesicles. (G) RNA-seq data of several genes in P1 control and 6F; Cre β cells (n=3). The P-values (t-test) of several genes were marked on the top. (H) Real-time RT-PCR assays of Syt4 in hand-picked P14 islets in control and 6F; Cre islets (n=3). (I) Expression levels of Myt genes from purified β cells (via MipeGFP expression) at different postnatal stages via RNA-seq (n=3). (J–M) Immunofluorescence assays of Myt1 protein levels in β cells of different ages. Wild type (CD1) mice were used. For quantification in (M), ~200 cells were used from each stage.

