
Figure 6.
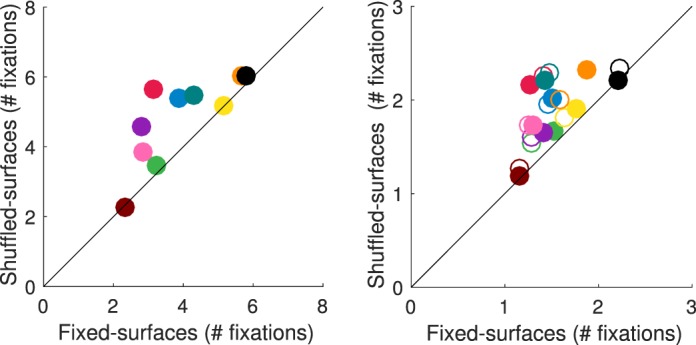
Number of fixations across conditions. For each observer the average number of fixations (across trials) in the shuffled-surfaces condition is plotted against the corresponding average in the fixed-surfaces condition (left panel: target interval; right panel: comparison intervals; filled circles indicate first comparison interval, and open circles second comparison interval). The standard error of the measurement (±1 SEM) is in all cases smaller than the plotted points. A unique color is used for each observer. Observer AZM (Figure 5A) is shown in red and observer EOM (Figure 5B) in brown. In the supplement, a key is provided to relate each observer's fixation plots to the color code scheme used in this and similar figures below.