
Figure 7.
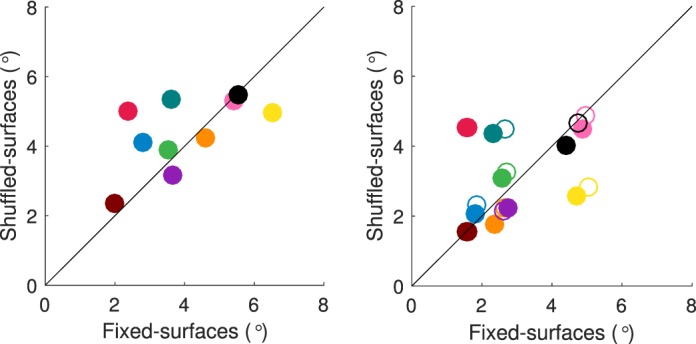
Spread of fixations across conditions. The joint standard deviation of fixation locations in the shuffled-surfaces condition is plotted against the joint standard deviation (in degrees of visual angle) in the fixed-surfaces condition for each observer (left panel: target interval; right panel: comparison intervals with filled circles indicating the first, and open circles the second comparison interval). Colors indicate observers, using the same scheme as in Figure 6.