
Figure 8.
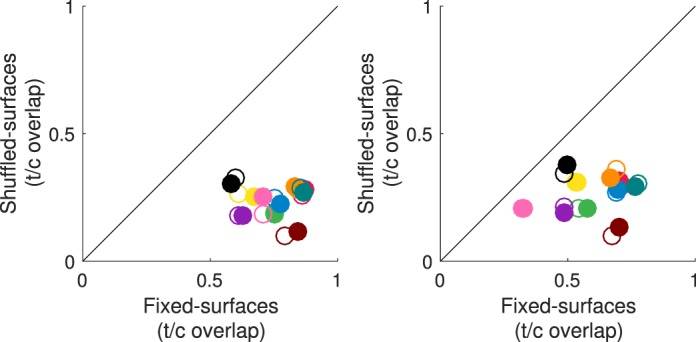
Surface reflectance fixation analysis. Left panel. The proportion of unique surface reflectances fixated in the comparison interval that overlap with those from the target interval (averaged across trials) is compared across the shuffled-surfaces condition (y axis) and fixed-surfaces conditions (x axis; label “t/c overlap” refers to target/comparison overlap). Filled circles: target versus first comparison interval; Open circles: target versus second comparison interval. Colors indicate observers, using the same scheme as in Figure 6. SEM (±1) is in all cases smaller than the plotted points. Right panel. Same as left panel, but where each target interval is paired with comparison intervals chosen at random from different trials.