Figure 3. Mapping roX1 and roX2 of the X chromosome dosage compensation complex.
(A) Illustration of the roX1/roX2 spreading across the solitary X chromosome in male flies (CME-W1-cl8+ cell line). In contrast, the female-derived Kc167 cell line expresses significantly lower levels of the MSL2 complex, which mediates the association of roX1 and roX2, which therefore do not coat either of the two X-chromosomes in females. (B) Circos plot showing roX2 spreading from its site of transcription (red arrow) and binding with high density along the X-chromosome but low density binding throughout the genome. (C) Coverage plots of roX1 (blue), roX2 (purple), snRNA:7SK (cyan) and Hsromega (green) in male CME-W1-cl8+ cells. Tracks are DpnII normalized reads. ChAR-seq data were subsampled to match the read depth of the Kc167 sample. (D) Complementary coverage plots generated from female Kc167 cells. (E) Comparison of ChAR-seq (this work) to an alternative RNA-to-chromatin mapping method called ChIRP-seq (data from reference [Quinn et al., 2014]). Tracks for roX1 (upper, blue) and roX2 (lower, purple) were generated from 32308 and 87453 contacts, respectively, from a ChAR-seq dataset containing a total of 22.2 million contacts. For comparison, the roX1 and roX2 tracks derived from ChIRP-seq each represent greater that 20 million reads. To compare tracks at different read depths, the contact number was autoscaled, with the maximum peak height given a value of 1. (F) Comparison of the signal-to-noise ratio (see methods) between ChAR-seq and Chirp-seq for roX genes. ‘Raw reads’ is the number of roX reads present in each data set analyzed. (G) Correlation coefficients were calculated for roX1 and roX2 coverage tracks generated using ChIRP-seq and ChAR-seq and plotted relative to increasing bin size to estimate the resolution of the ChAR-seq assay.
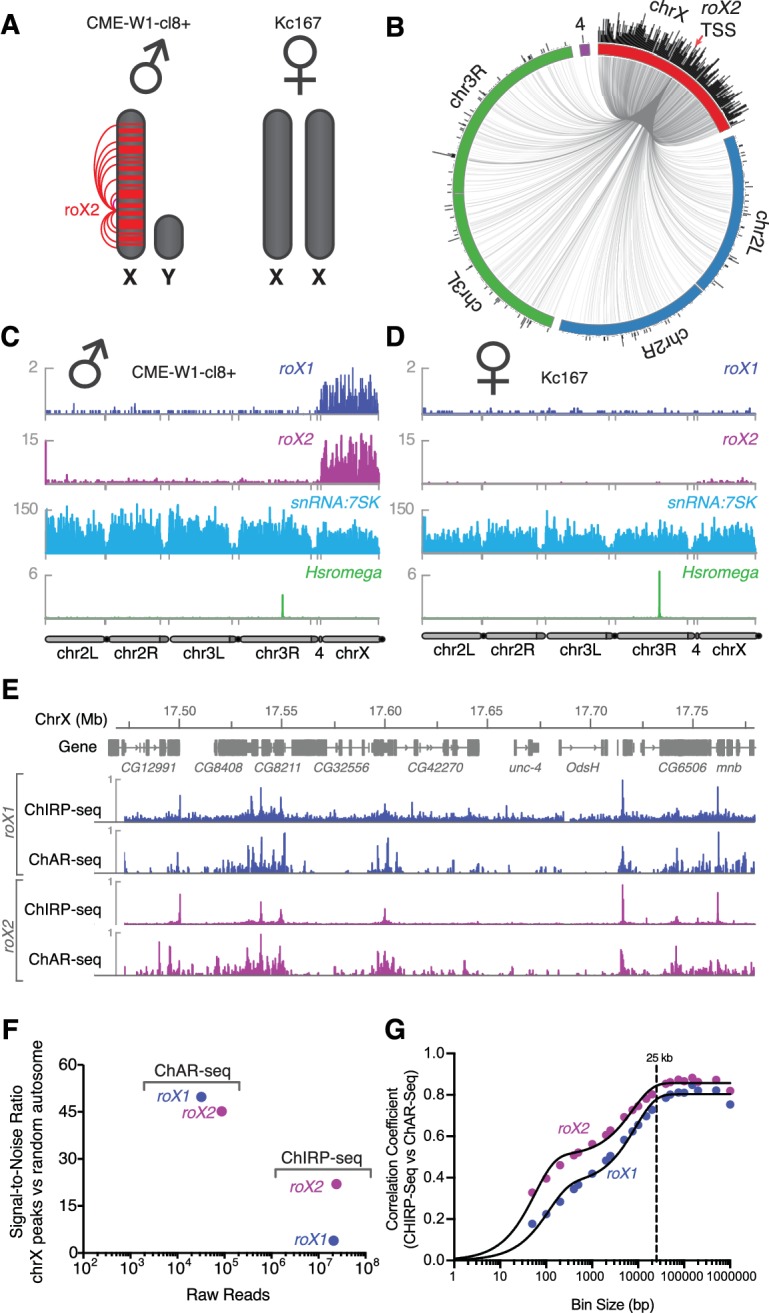
Figure 3—figure supplement 1. roX RNAs are enriched on the X chromosome.

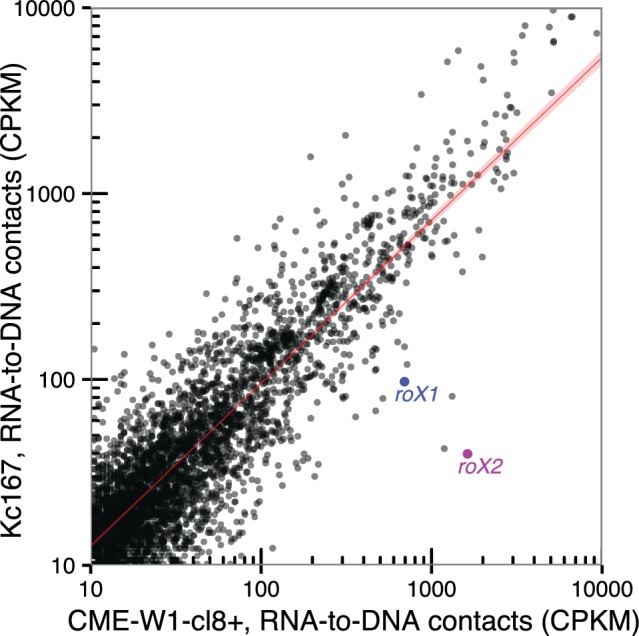
Figure 3—figure supplement 2. Comparison of RNA-to-DNA contacts between cell type.