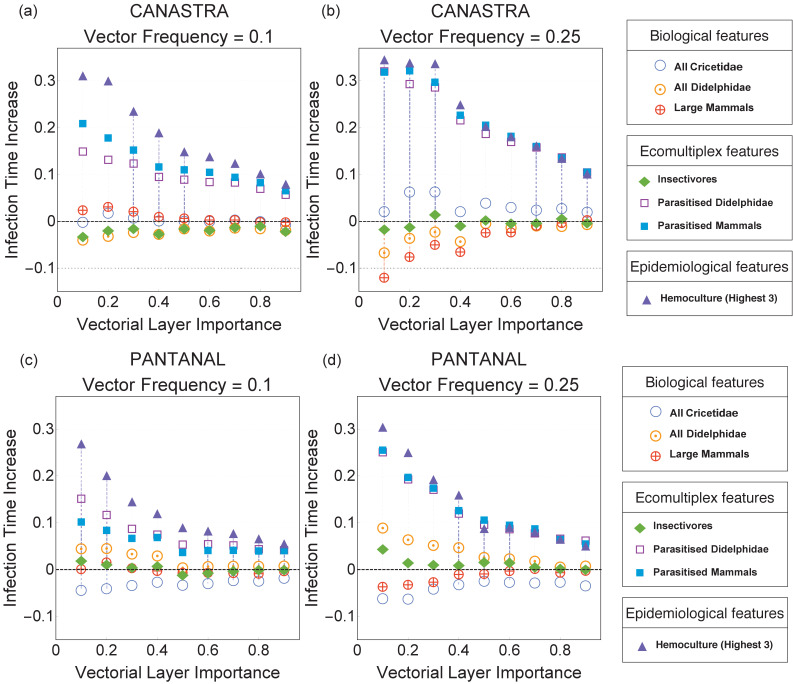
Figure 3. Immunisation strategies for the Canastra (top) and Pantanal (bottom) ecosystems when the vector frequency is 0.1 (left) and 0.25 (right).
The infection time increase plotted on the y-axis is defined in Immunisation Strategies (Methods and Materials). An increase of +0.3 indicates that the infection time in a given immunisation scenario was 30% higher than in the reference case of random immunisation.

